
Figure 1.
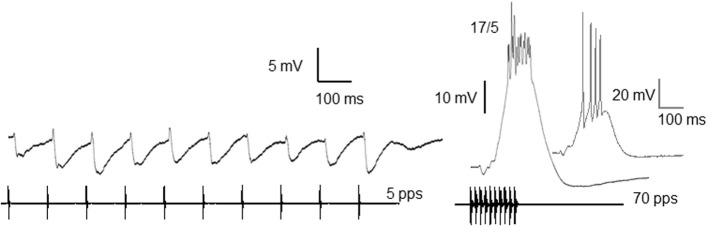
Whole-cell recordings of responses from an interval-counting neuron to stimulus pulses presented at 5 and 70 pulses/s. Averaged traces (black) and a single unaveraged trace (gray, inset) are shown. Ratios: number of spikes over the number of stimulus presentations. Resting potential = −68 mV; carrier frequency = 300 Hz; 66 dB SPL. Adapted from (Rose et al., 2011).