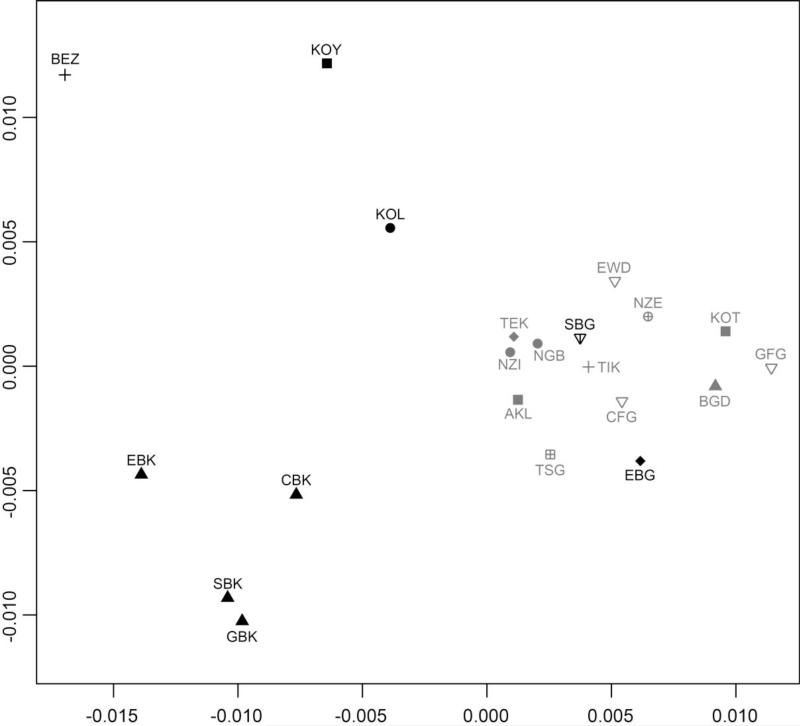
Figure 1. Multidimensional scaling representation of the pairwise genetic dissimilarities between Central African Pygmy and Non-Pygmy populations.
Metric multidimensional scaling (MDS) plot based on pairwise population genetic dissimilarities (FST, Weir and Cockerham 1984) computed using 28 autosomal tetranucleotide microsatellite markers genotyped in 9 Pygmy and 12 Non-Pygmy neighboring populations (FST matrix previously published in Verdu et al. (2009)). Non-significant pairwise FST values based on permutation tests were set to 0 prior to computing the metric MDS (Verdu et al. 2009). To evaluate how accurately the two-dimensional MDS plot represented the pairwise population genetic dissimilarities, we computed the Spearman correlation between the Euclidian distances among pairs of populations on the MDS plot and the corresponding values of pairwise genetic FST. We obtained a Spearman's rho equal to 0.84 (p-value < 10−5). Furthermore, we found that the Euclidian distance calculated between any two populations on the MDS plot provided the corresponding FST value plus or minus 0.004 on average.
Pygmy populations are labeled in black as follows: BEZ = Bezan, central Cameroon; CBK = Baka, central-eastern Cameroon; EBG = Bongo, eastern Gabon; EBK = Baka, southeastern Cameroon; GBK = Baka, northern Gabon; KOL = Kola, western Cameroon; KOY = Koya, northeastern Gabon; SBG = Bongo, southern Gabon; SBK = Baka, southern Cameroon. Non-Pygmy populations are labeled in grey as follows: AKL = Akele, eastern Gabon (Bongomo); BGD = Bangando, southeastern Cameroon; CFG = Fang, southern Cameroon; EWD = Ewondo, central Cameroon; GFG = Fang, northern Gabon; KOT = Kota, central Gabon; NGB = Ngumba, western Cameroon; NZE = Nzebi, southeastern Gabon; NZI = Nzime, central-eastern Cameroon; TEK = Teke, eastern Gabon; TIK = Tikar, central Cameroon; TSG = Tsogho, central Gabon.
The linguistic affiliation of samples is mainly based on (Greenberg 1966; Guthrie 1967) reads as follows: Adamawa-Ubanguian family = (▲); Bantoid Non-Bantu family = (+); Bantu family: A.70 = (▽); A.80 = (●); B.20 = (■); B.30 = ( ); B.30-B.50 = (
 ); B.50 = (
 ); B.70 = (◆).

