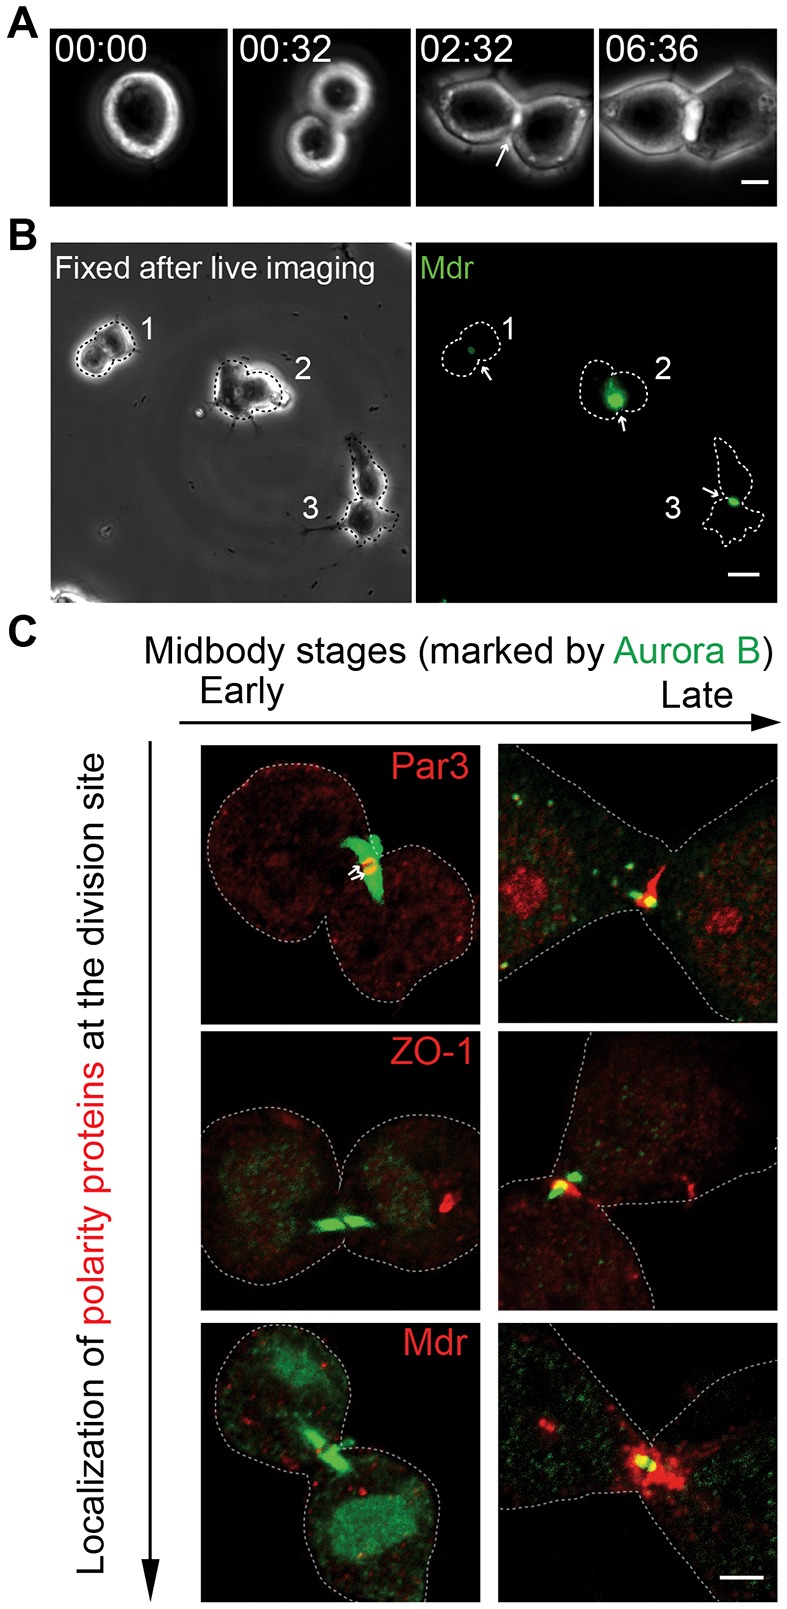
Fig. 1.

Cytokinesis defines a spatial landmark for hepatocyte polarization and bile canaliculus formation. (A) Time-lapse analysis of cytokinesis and bile canaliculus formation in Can 10 cells. See also supplementary material Movie 1. Time, h:min. (B) Can 10 cells were analyzed by time-lapse microscopy (see also supplementary material Movie 2) and then fixed and stained for Mdr (green, arrow). Dotted lines denote the cell outline. (C) Localization of Par3 (top row, red), ZO-1 (middle row, red) and Mdr (bottom row, red) during different midbody stages (Aurora B, green). Arrows indicate the association between Par3 and Aurora-B-decorated microtubule arrays. Scale bars: 3 µm (A,C); 10 µm (B).
