Fig. 1.
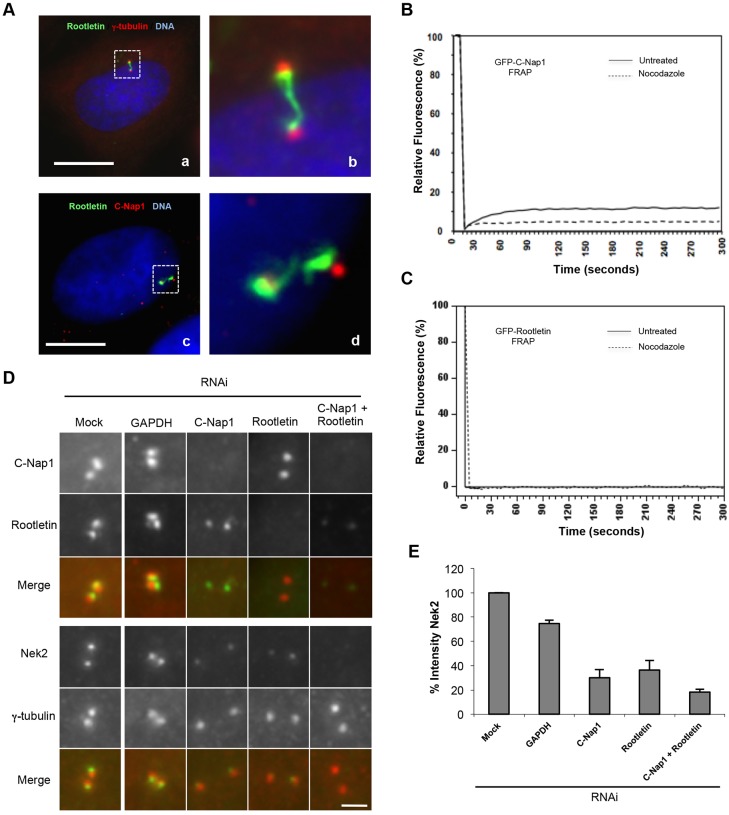
Nek2 is recruited to the centrosome by stable intercentriolar linker components. (A) Immunofluorescence images of HeLa cells stained with antibodies against rootletin (green) and either γ-tubulin (a,b) or C-Nap1 (c,d) (red), and Hoechst 33342 to visualize DNA (blue). Panels b and d are enlargements of the regions outlined in panels a and c, respectively. Scale bars: 10 µm. (B,C) FRAP analysis of U2OS cells transiently transfected for 24 hours with GFP-tagged C-Nap1 (B) or rootletin (C) and treated with or without nocodazole to depolymerize microtubules. A region of interest (ROI) encompassing the centrosomes was selected and three images were collected before the ROI was bleached three times (100% argon laser, 488 nm). The fluorescence intensity relative to pre-bleach was then calculated over 300 seconds for the ROI and an average recovery profile was plotted for each construct (n = 20). (D) Immunofluorescence images of centrosomes from HeLa cells that were either mock treated or depleted by RNAi for 48 hours of GAPDH, C-Nap1, rootletin or C-Nap1 and rootletin together, and stained with antibodies against C-Nap1 (red) and rootletin (green), or γ-tubulin (red) and Nek2 (green), as indicated. Merged images are shown. Scale bar: 1.5 µm. (E) The centrosome intensity of Nek2 in cells depleted as in D relative to mock-depleted cells. Data show the mean±s.d. (three independent experiments, 35 centrosomes per condition per experiment).

