Fig. 2.
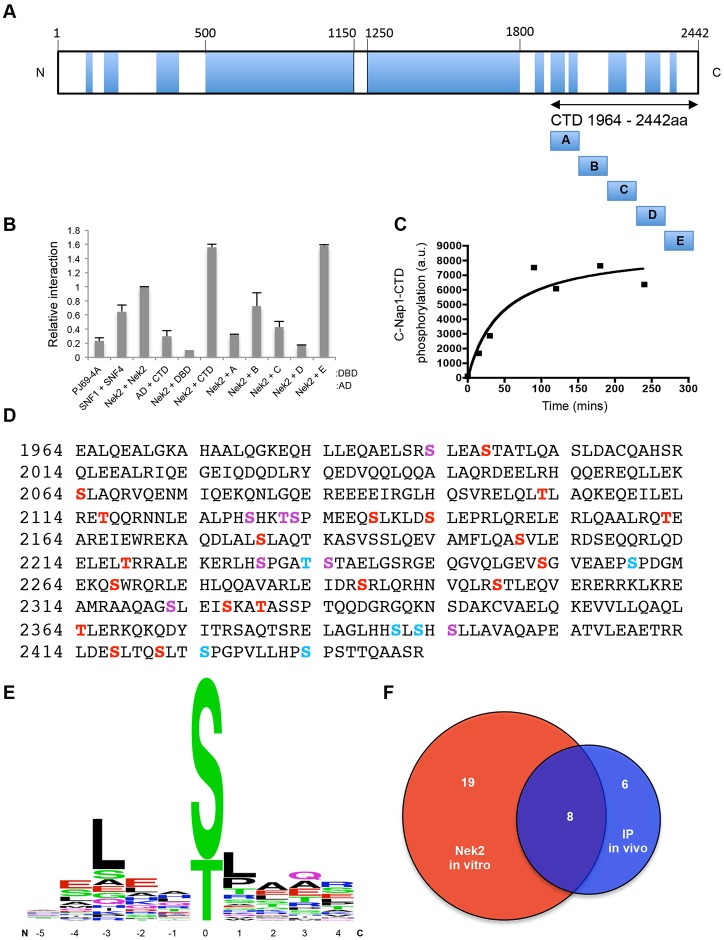
Multisite phosphorylation of the C-Nap1 CTD by Nek2. (A) Schematic diagram of C-Nap1 protein with predicted coiled-coils (blue). The C-terminal domain (CTD), residues 1964–2442, and five sub-fragments of this region are indicated: A (1964–2070), B (2062–2168), C (2162–2268), D (2262–2368) and E (2362–2442). (B) Yeast two-hybrid interaction activity between the pairs of constructs indicated is shown relative to the homodimeric interaction of Nek2A (arbitrarily assigned as 1). The first protein in each pair is a GAL4 activation domain (AD) fusion and the second protein is a GAL4 DNA-binding domain (DBD) fusion. Activity from untransformed yeast (PJ69-4A), the known interaction of SNF1 and SNF4, the CTD with AD alone, and Nek2 with the DBD alone are shown. Fragments A to E are those shown in panel A. Data show the mean±s.d. (three independent experiments). (C) Timecourse of in vitro phosphorylation of a purified GST-tagged C-Nap1 CTD protein by recombinant Nek2A. Graph indicates 32P incorporation in arbitrary units (a.u.), as determined by scintillation counting of bands excised from an SDS-polyacrylamide gel. (D) Amino acid sequence of the C-Nap1 CTD highlighting residues that are phosphorylated in vivo (blue), in vitro by Nek2 (red) and both (purple). (E) Weblogo analysis of the Nek2 consensus phosphorylation site, based on sites phosphorylated by Nek2 within the C-Nap1 CTD in vitro. (F) Venn diagram showing the relative proportion of phosphorylation sites found on the CTD phosphorylated by Nek2 in vitro and those identified in vivo (colors as in D).

