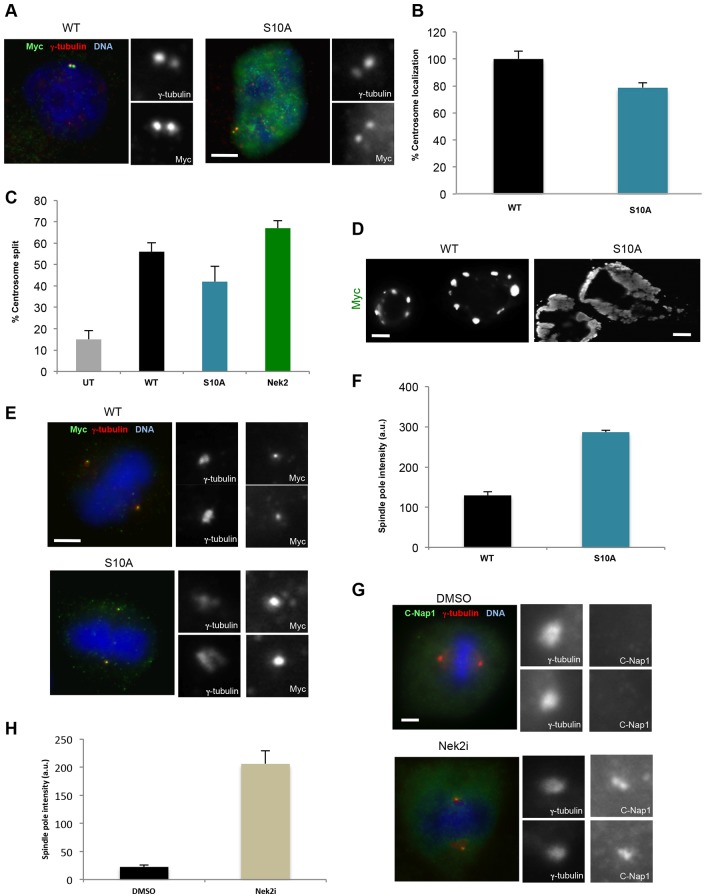
Fig. 5.
Non-phosphorylatable C-Nap1-CTD is retained on spindle poles. (A) U2OS cells were transfected with the constructs indicated and stained using antibodies against γ-tubulin (red) and Myc (green), along with the DNA stain Hoechst 33342 (blue). WT, wild type. (B) The percentage of transfected cells in which the recombinant protein was detected at the centrosome is shown (n = 50). (C) The percentage of interphase cells transfected with the constructs indicated in which the two centrosomes were split (>2 µm) is shown (n = 100). UT, untransfected cells. (D) U2OS cells were transfected with the constructs indicated and stained with anti-Myc antibodies (grayscale) revealing the extensive patch formation by the CTD-S10A protein. (E) U2OS cells were transfected with the indicated constructs and stained using antibodies against γ-tubulin (red) and Myc (green), along with the DNA stain Hoechst 33342 (blue). Metaphase cells are shown. (F) Mean spindle pole intensities (a.u., arbitrary units) of transfected proteins in metaphase cells are indicated, based on Myc staining (n = 20). (G) U2OS cells were synchronized in G2 with RO-3306 for 16 hours before release into fresh medium with 10 µM Nek2 inhibitor, R21, (or DMSO as control) for 3 hours. Cells were stained with antibodies against γ-tubulin (red) and C-Nap1 (green), and the DNA stain Hoechst 33342 (blue). Magnified views of centrosomes are shown in A, E and G. Scale bars: 5 µm. (H) Spindle pole intensity of endogenous C-Nap1 was determined in 20 metaphase cells treated as in G. All data show the mean±s.d. (at least three independent experiments).

