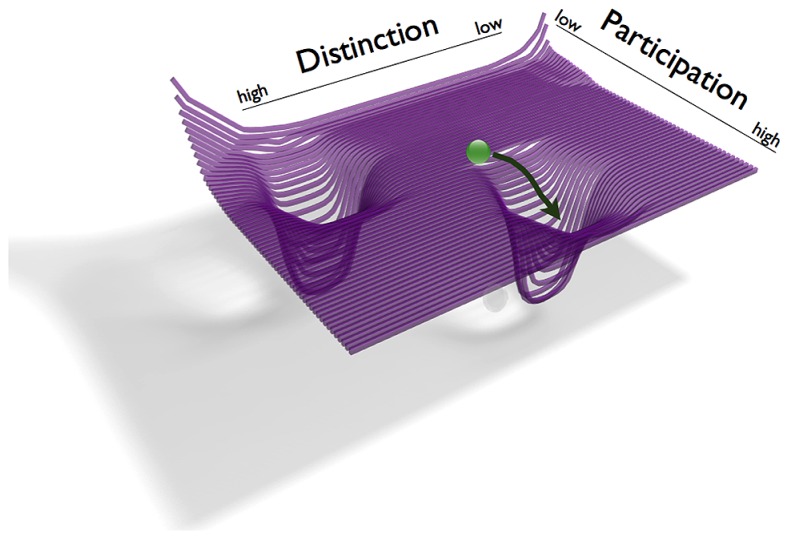
FIGURE 3.
Illustration of the joint phase space of the couple in example 1. The dyadic phase space is a summation of the individual phase spaces (his low D and high P and her high D and low P, see Figure 1). The graphic illustrates the couple’s states during the initial months of the relationship (t1). The green ball symbolizes that they move in a region with higher values of participation.

