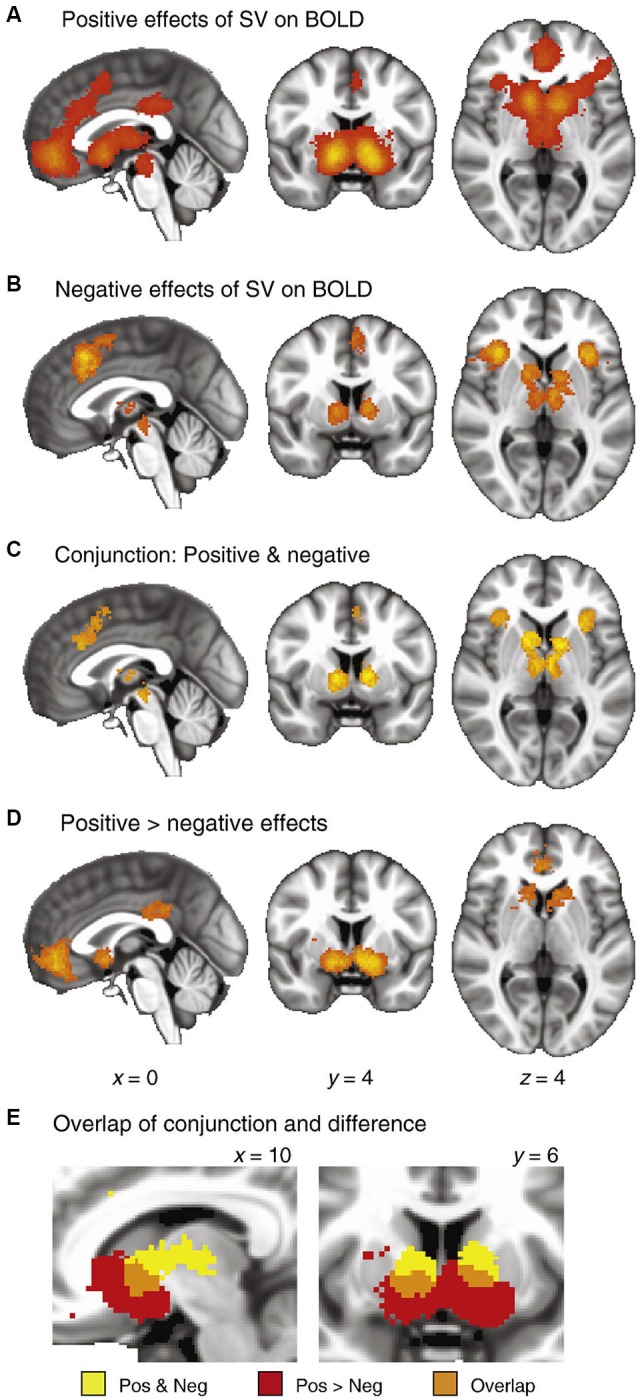
Figure 1.

Meta-analysis of fMRI studies of value (taken from Bartra et al., 2013). The authors extracted peak coordinates of activation from 206 published fMRI studies that investigated value computations. (A) Significant clustering of positive responses. (B) Significant clustering of negative responses. (C) Conjunction maps, showing regions with significant clustering for both positive and negative responses. (D) Results of a between-category comparison, showing regions with significantly greater clustering for positive than negative effects. (E) Detail of the striatum, illustrating overlap between the conjunction map (Panel C) and the difference map (Panel D). These data demonstrate the relative response of anterior insula, striatum and ventromedial PFC to positive and negative value.
