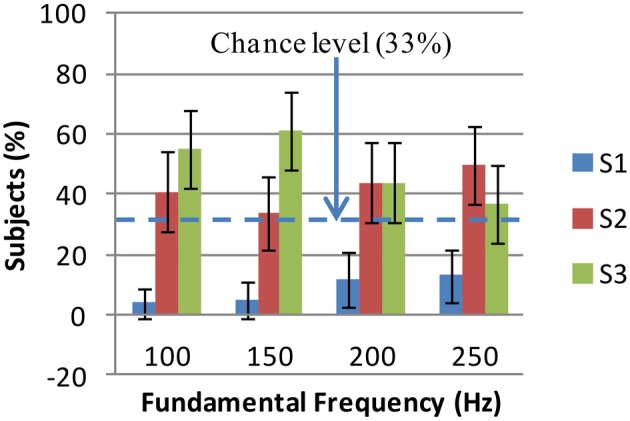
Figure 4.

Grayscale shape selections for fundamental frequency: the percentages of subjects who have selected shapes S1 (jagged), S2 (mixed), and S3 (rounded) for each fundamental frequency are shown. The error bars show Bonferroni adjusted 99.59% confidence intervals (obtained by Z-test). S1 is the least selected shape at all frequencies (< 13%). There is no significant difference between S3 and S2 percentages except at 150 Hz where S3 is the mostly selected shape (61%). At other frequencies, S2 and S3 are almost equally selected (see text for details). S1, S2, and S3 are the shapes shown in Figure 2.
