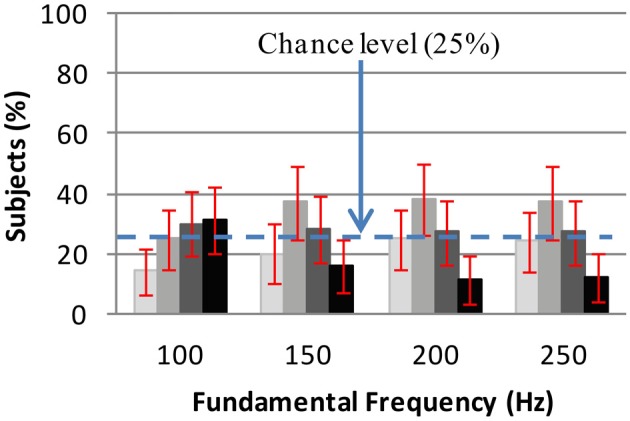
Figure 6.

Grayscale selections for fundamental frequency: each grayscale bar shows the selection rate of the same grayscale. The error bars show the 98.3% confidence intervals for the selection rates. The grayscales are, from the lightest to the darkest, 0.9, 0.6, 0.3, and 0 (black). When considered alone, the grayscales are not associated with fundamental frequency. But when dark scales (0 and 0.3) are compared with lighter scales (0.6 and 0.9), dark scales selections have decreased while lighter scales selections have increased with fundamental frequency (See details in the text).
