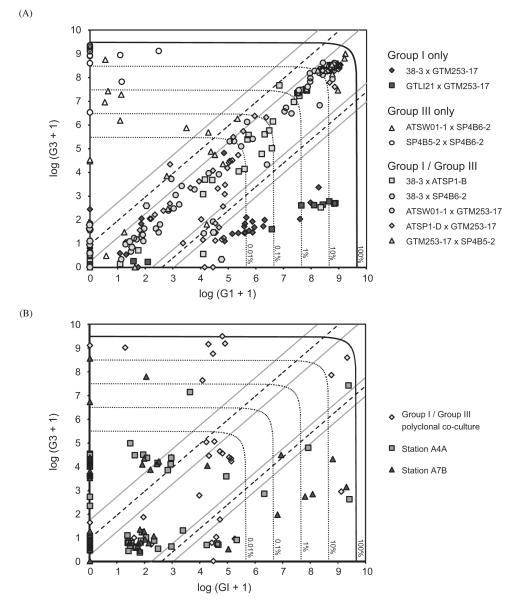
Fig. 4.
Single hypnozygote genotyping by nested PCR. (A) Results of hypnozygotes from pairwise co-culture of Group I and III isolates (‘knowns’). Lysis efficiency contours (0.01%, 0.1%, 1%, 10% and 100%) are expected numbers of amplicons after primary D1R–D2C PCR. Group I/hybrid and hybrid/Group III thresholds are indicated by dashed diagonal lines; gray diagonal lines indicate regions about the thresholds where classification probability is less than 95% (see text, Fig. 5). (B) Results of hypnozygotes from a polyclonal Group I/III co-culture and two sediment samples taken within Belfast Lough (survey stations A4A and A7B). Lysis efficiency contours and classification boundaries are drawn as in (A).

