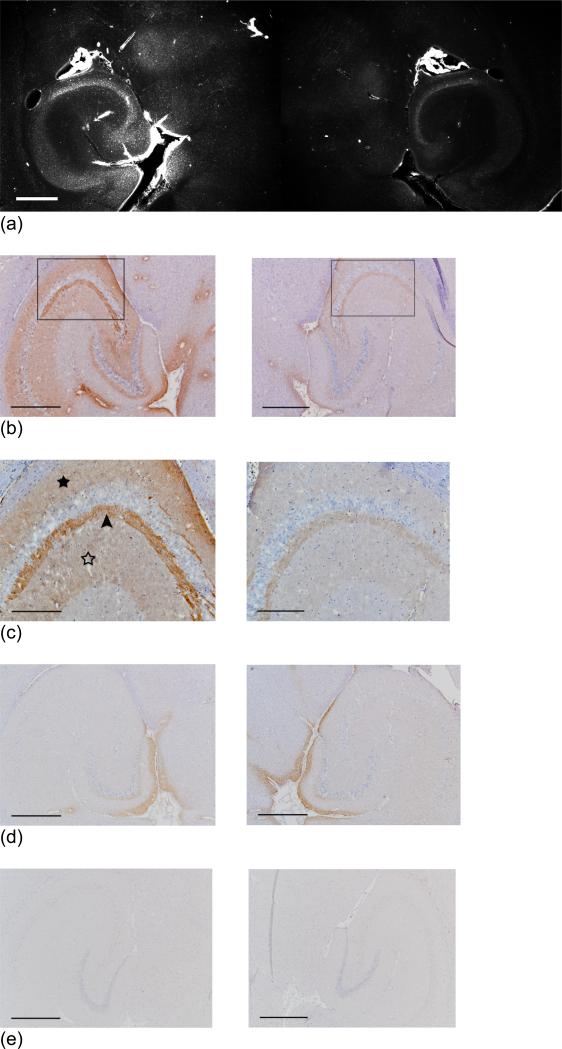
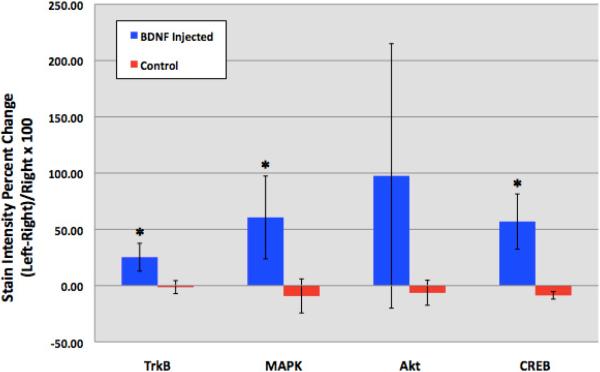
Fig. (10).
(a) Fluorescent image of a 100-micron frozen brain section from a mouse that was sacrificed 20 min after sonication. The sonicated hippocampus (left) shows much higher fluorescent intensity than the un-sonicated hippocampus (right), depicting blood-brain barrier opening and the extravasation of fluorescent-tagged (Alexa Fluor 594) BDNF in the sonicated region; (b) a 5-micron frozen section from the same mouse was immunohistochemically stained using a primary antibody against phosphorylated MAPK (pMAPK). Consistent with the fluorescent image in (a), the intensity of DAB staining is much greater in the left sonicated hippocampus compared to the right control; the black box shows the enlarged area in (c), where immunoreactivity to pMAPK is shown in mossy fiber terminals (arrowhead), suprapyramidal CA3 dendrites (black star), and the axons of the Schaffer collateral system (hollow star); (d) immunohistochemical staining of a 5-micron frozen section from a mouse that was sacrificed 3 min after sonication; the same primary antibody against pMAPK was used. No difference in DAB intensity is observed between the sonicated and the control hippocampus; (e) Negative control for the same mouse in (a); no primary antibody (against pMAPK) was added to this 5-micron frozen section during the staining procedure. All magnifications are 40x and scale bars are 500 μm except for (c), which is 100x and 200 μm, respectively. In (f), immunohistology stain intensity analysis shows percentage change between the left (FUS) and the right (no FUS) sides of the mice brains. A significant difference (p<0.05, N=3; depicted by asterisks) was found between the BDNF administered animal group and the control (no BDNF) animal group for the TrkB, MAPK, and CREB antibodies. Bars represent mean ± standard deviation [63].


