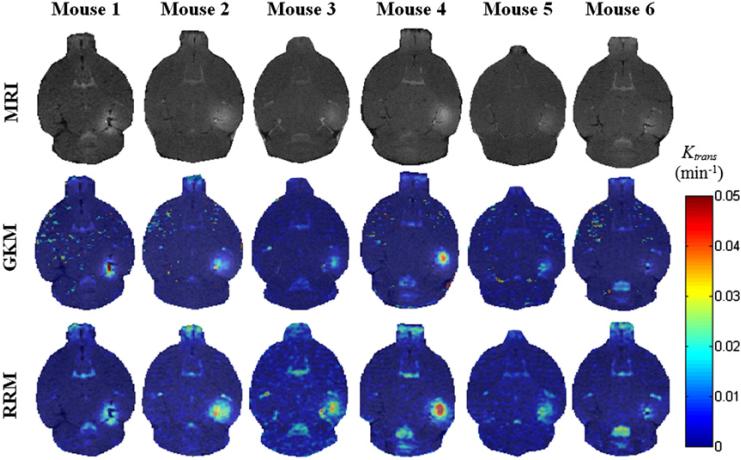
Fig. (8).
T1 images (first row) and their corresponding permeability maps generated from two different kinetic models, GKM (second row) and RRM (third row) for all mice. The transverse slice with maximum T1 signal enhancement is selected. The Ktrans values are indicated in the colorbar. The maps have been superimposed over the corresponding DCE-MR images. In the case of mouse 1, the last acquired DCE-MR image is presented instead of a regular T1 [61].

