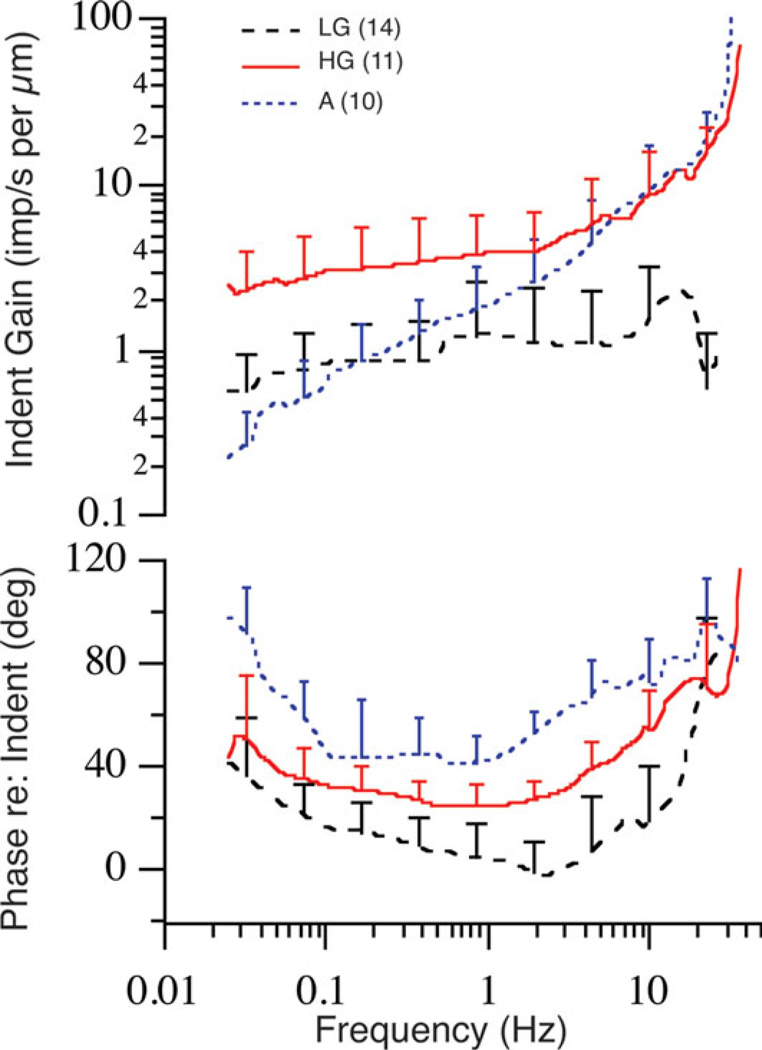
Fig. 7.
Summary of afferent responses to canal indentation in the toadfish. Afferents are grouped according to gain and phase into low gain (LG; dashed black line), high gain (HG; solid red line) acceleration (A; stippled blue line) sensitive fibers. Error bars show the standard deviations associated with inter-afferent variability within each group and thus span the region between the average curves. Replotted from Highstein et al., 1996.

