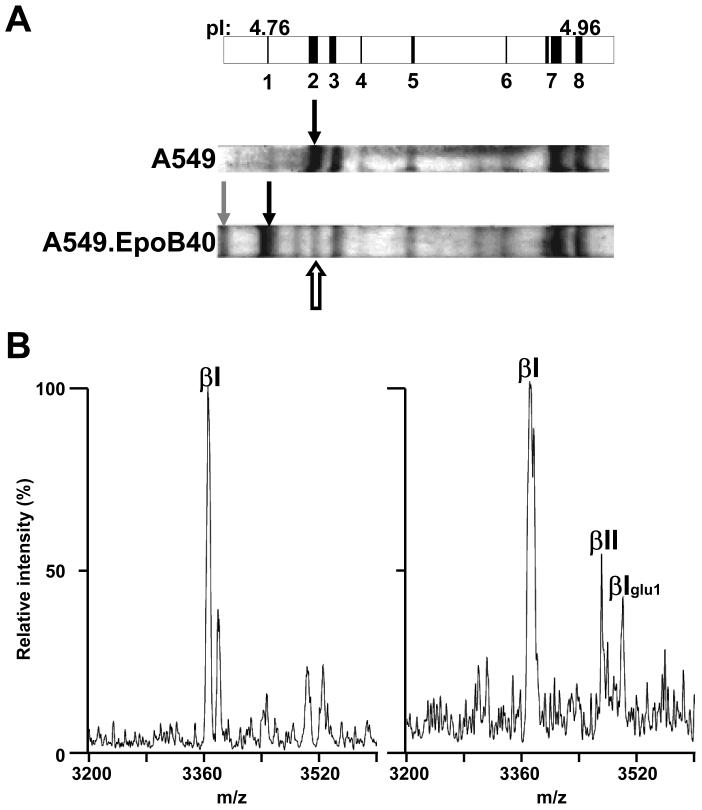
Figure 2. Mass spectrometry analysis of CNBr C-terminal peptides from IEF-separated tubulin isotypes from A549 and A549.EpoB40 cells.
A, Schematic representation of a portion of an IPG strip (pH 4.5–5.5) with predicted positions of tubulin isotypes depicted as vertical black bands starting with monoglutamylated βI-tubulin (band 1, pI: 4.76) and finishing with α1C-tubulin (band 8, pI: 4.96). Bands 2 to 7 represent βI-, βIVb-, monoglutamylated βIII-, βIII, monoglutamylated α1B-, tyrosinated α4A/α1B- and α1C-tubulin, respectively. On Coomassie-stained IEF gels, the black indicate the position of wild type and mutated βI-tubulin from A549 and A549.EpoB40, respectively. The white arrow and the grey arrow indicate the focalization position of βII-and monoglutamylated mutated βI-tubulin, respectively. B, the bands corresponding to mutated βI-tubulin (left panel) and βII tubulin (right panel)were cut out and the protein was cleaved by CNBr. Peptides were analyzed by MALDI-TOF MS in the negative mode and only the band expected to contain βII-tubulin produced a small m/z peak (3467.71) corresponding to the C-terminus of βII-tubulin. Another m/z peak at 3496.50 corresponded to contaminating monoglutamylated βI tubulin (βIglu1). Maximal intensity is 114 for left spectrum vs 30 for right spectrum.

