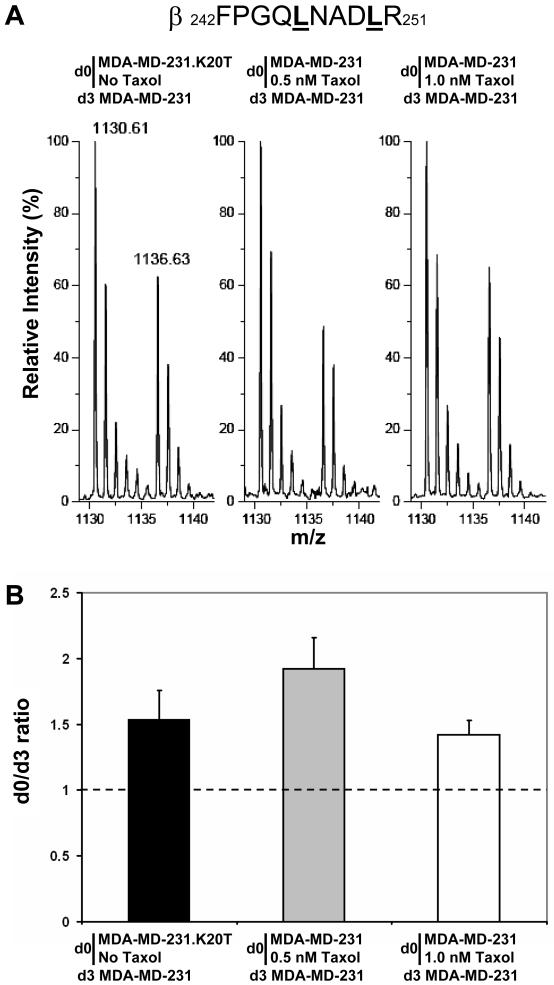
Figure 4. Relative quantitation of total tubulin expression by SILAC.
A, relative intensities of the m/z peaks of β-tubulin peptide β242-251 were obtained from SILAC experiments using d0- or d3-Leu in cell culture medium. The two leucine residues present in the β242-251 peptide are underlined and a difference of 6 Da is observed between the d0-β242-251 and d3-β242-251 m/z peaks. B, relative quantitation of total β-tubulin expression obtained after deisotoping of m/z peaks and averaging of relative intensities of m/z peaks in spectra from different β-tubulin peptides containing Leu. Tubulin was isolated and analyzed by MALDI-TOF MS from the following experiments as indicated on the top of mass spectra in A and under each bar of the graph in B: MDA-MD-231.K20T cells were cultured in the presence of d0-Leu after removal of normal culture medium containing 20 nM Taxol and one passage in Taxol-free medium. MDA-MD-231 cells were cultured in the presence of d3-Leu; MDA-MD-231 cells were maintained in the presence of d0-Leu and treated with 0.5 nM Taxol for 24 h, and untreated MDA-MD-231 cells were maintained in the presence of d3-Leu; MDA-MD-231 cells were maintained in the presence of d0-Leu and treated with 1.0 nM Taxol for 24 h, and untreated MDA-MD-231 cells were maintained in the presence of d3-Leu.

