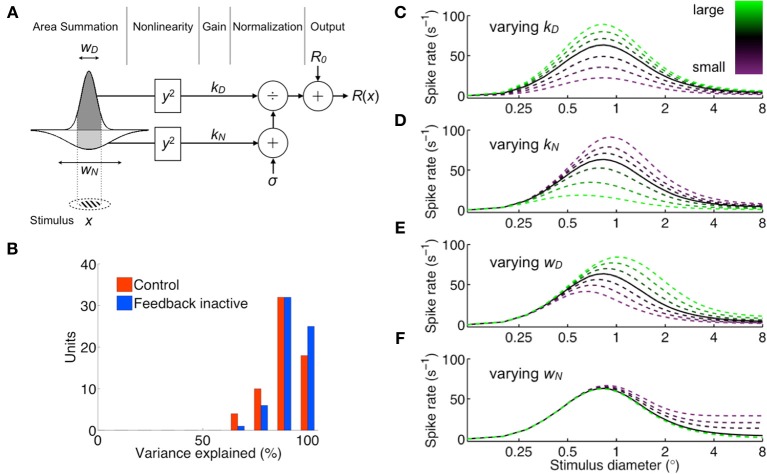
Figure 2.
Normalization area summation model (ratio of Gaussians). (A) Schematic representation of the model. The receptive-field-centered grating stimulus of diameter x determines the integration bounds of the excitatory drive (dark shading) and normalization pool (light shading) area summation components, characterized by spatial parameters wD and wN, respectively. Their outputs are squared and amplified by gains kD and kN before normalization. The constant σ represents baseline normalization pool activity and is set to unity without loss of generality. R0 is the measured spontaneous rate, and R(x) is the response spike rate. (B) Summary of model goodness-of-fit per unit for both control (red) and feedback inactive (blue) conditions (median variance explained: 90% control, 93% feedback inactive). (C–F), Illustration of area summation curve effects due to individual variation of each model parameter. Population-averaged parameters produce solid black curve, and the effects of increasing/decreasing one parameter are plotted as green/purple broken curves.

