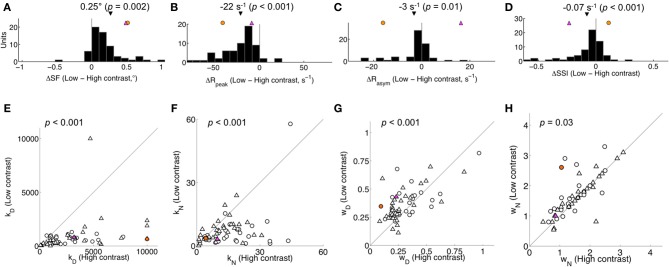
Figure 5.

Population effect of stimulus contrast on area summation during the control condition. (A–D) Summation curve features: difference in summation field (SF), peak response rate (Rpeak), asymptote response rate (Rasym), and surround suppression index (SSI) between high and low contrast stimuli. Black triangle indicates population mean (with two-tailed t-test p-value). (E–H) Parameter estimates (kD, kN, wD, wN) for all units plotted for high contrast vs. low contrast conditions. p-values correspond to a two-tailed Mann-Whitney U-test for kD and kN, and a t-test for wD and wN. Triangles and circles indicate single- and multi-units, respectively. Differences were not detected in any feature (A–D) or parameter (E–H) when comparing across single- and multi-unit subpopulations (each p > 0.05). In all panels, the magenta and orange symbols indicate features for example units in Figure 1. Reducing contrast increased the summation field, decreased the peak response rate, and yielded a small decrement in the asymptotic rate and suppression index. Both gain parameters increased and wD decreased with high contrast.
