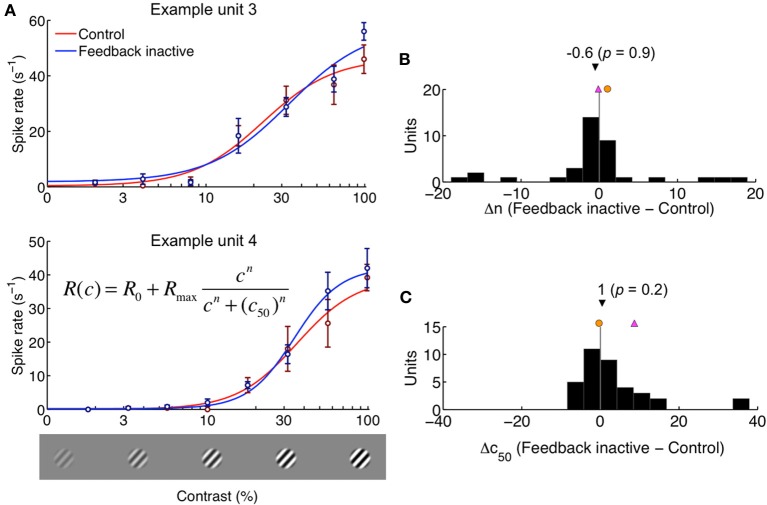
Figure 8.
Contrast sensitivity is unaltered by feedback inactivation. (A) Contrast response functions plotted for two example units. The grating was restricted to the center of the receptive field. Data are shown as mean ± s.e.m., and curves were obtained using the Naka-Rushton model (inset equation) by fitting the parameters n and c50. The spike rates for spontaneous activity (R0) and maximum response (Rmax) were measured. (B) Difference in parameter n between Feedback inactive and Control conditions. (C) Difference in parameter c50 between Feedback inactive and Control conditions. Black triangle indicates population median (with two-tailed Mann-Whitney U-test p-value). Magenta and orange symbols indicate shifts for example units shown in (A). Feedback-inactivation did not lead to a systematic effect in contrast response function parameters.

