
FIG. 3.
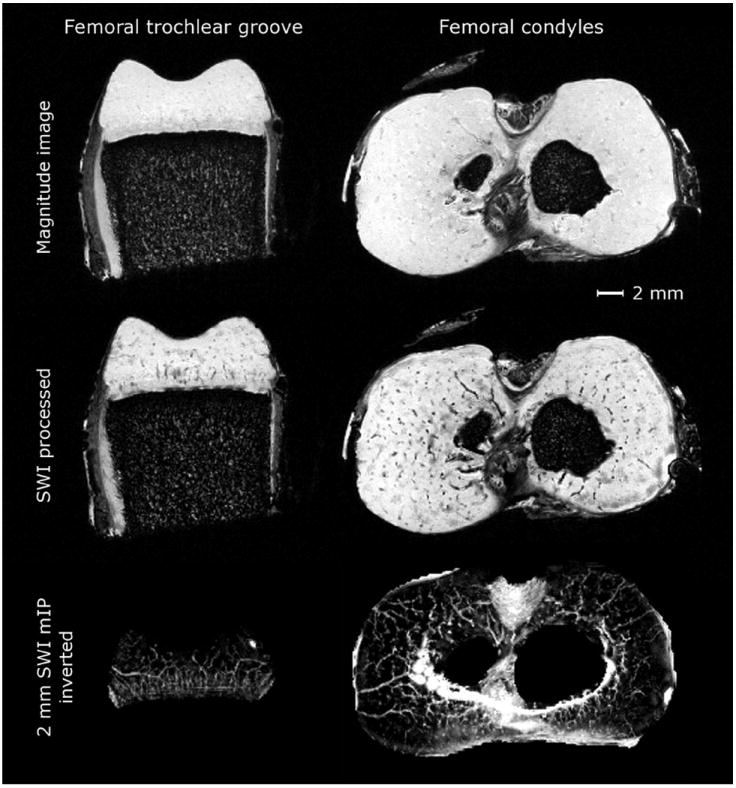
Raw GRE data and effect of SWI processing, data from 9.4 T. First row: raw GRE data in axial slices through distal femoral trochlea and condyles in a specimen from 1-week-old piglet. Second row: marked increase in the visibility of the vessels over the raw GRE data after SWI post-processing. Third row: further improvement in the visualization was achieved by generating a mIP over selected thickness (2 mm). The background was removed from the inverted data using thresholding.