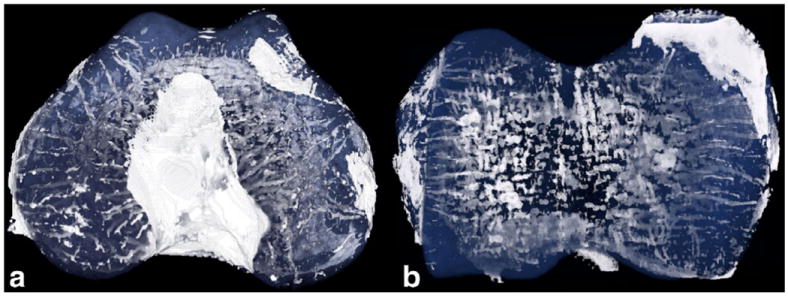
FIG. 5.

Projection of a 3D-volume rendering of the SWI dataset of (a) distal femur and (b) distal humerus of a 1-week-old piglet, data from 9.4 T. Background and bone were removed before the visualization using appropriate thresholding and masking. A color lookup table was created with opaque white for signal intensity corresponding to vessels and semitransparent blue for the epiphyseal cartilage matrix. Signal intensity similar to the vessels for ligaments, most notably in the intercondylar notch, was seen.
