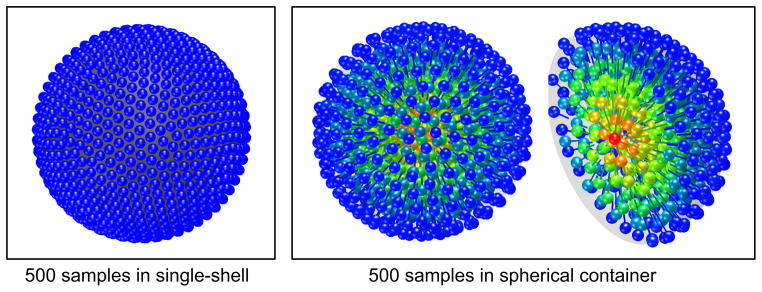
Fig. 1.

Results from optimization of a 500 sample positions in Q-space. Classic Jones single-shell electrostatic repulsion (left). Electrostatic forces with spherical container (right). The rightmost plot shows only half of the sphere to display the interior sampling. Colors indicate distance to the container center, Red = 0, Blue = 1.
