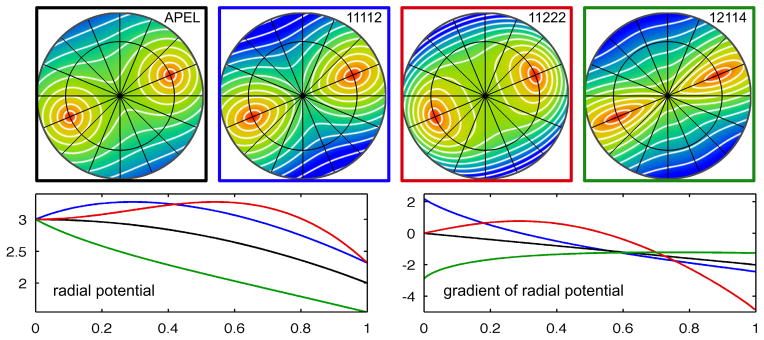
Fig. 2.

Four distance maps generated by the metrics used in the experiments (top). The plots show distances from a reference point positioned at the center of the red area. Due to symmetry the 3D distance map is rotation invariant, i.e. the distance maps on any plane through the origin and the reference point are identical. The white lines are iso-distance lines (iso-surfaces in 3D). Note the variation in radial/angular metric ratio around the reference point, this ratio links strongly to the shell forming behavior shown in figure 3. The colored curves show container potentials (lower left) and the corresponding gradients (lower right) as a function of radius for the same four metrics. The curves have the same color as the frame of the corresponding distance map: APEL (black), T-11112 (blue), T-11222 (red) and T-12114 (green).
