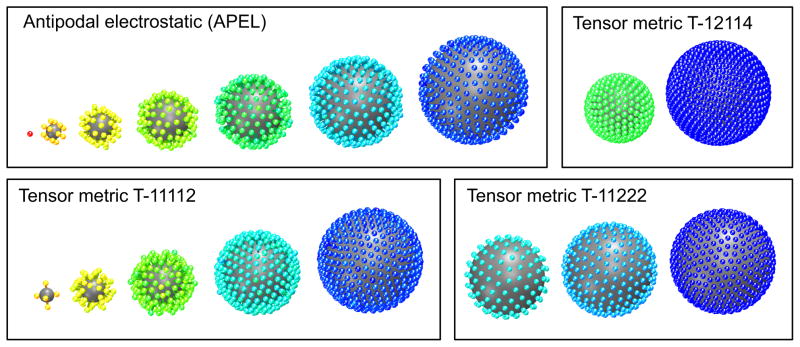
Fig. 3.
Four examples of the forming of shells that occur using the charged container approach. The shells have been segmented and are shown separately from the center out, left to right. The color indicate sample radius. The upper left result is also shown in a non-segmented version in figure 1 right. All examples have 500 sample points. The plots clearly show that the different metrics gives rise to radically different sample distributions and shell forming behavior. Intuitively it makes sense that if the ratio angular/radial distance increases (see figure 2), i.e. the surface area of a sphere increases relative to it’s radius, fewer shells with more samples in each will be formed.

