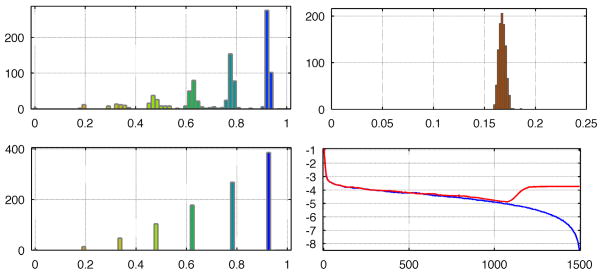
Fig. 4.
Plots displaying different features of the optimization of a 500 sample point distribution using the antipodal electrostatic metric (APEL). Histogram of number of samples vs radius, the forming of shells is clearly visible (top left). Histogram of samples vs distance to closest neighbors, the narrow peak shows that the distribution is highly uniform in Q-space (top right). Histogram of samples vs radius after the shells have been forced to become radially thin (bottom left). The 10-logarithm of the system energy vs number of iterations for two separate optimization runs (bottom right). The blue curve shows a typical run. The red curve shows a run where a gradually increasing extra force was applied to produce thin shells. Note that the end results has more than 4 orders of magnitude higher energy which shows that adding a ‘shelling’ forming force will produce precise shells but will increase the system energy considerably, i.e. the ‘soft’ shells provide a more even sample distribution.

