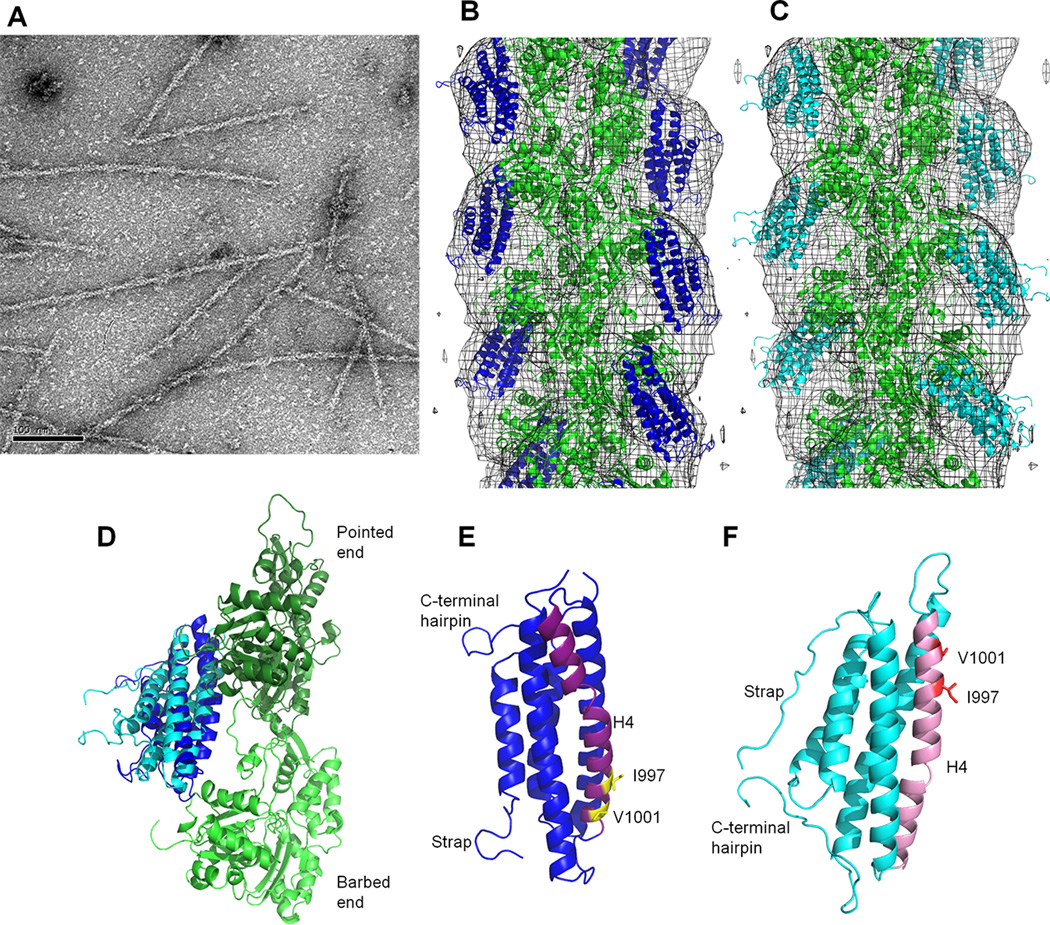
Figure 4. The proposed actin binding surface on Vt is consistent with EM reconstruction.
(A) Negative-stain EM image of F-actin decorated with VtWT. Scale bar is 100 nm. (B) Manual fit model of Vt bound to F-actin. Crystal structure of the Vt domain (blue ribbon, PDB 1QKR) and the atomic model of F-actin (green ribbon, PDB 3MFP) are manually docked into the 3D-reconstruction (gray mesh). (C) DMD model of Vt bound to F-actin. F-actin is in green, Vt in cyan. (D) Comparison of Vt domain orientation from B and C with respect to the two adjacent actin protomers (long-pitch helix F-actin dimer). The color scheme is maintained. (E,F) Comparison of Vt H4 orientation in the manual fit and DMD models from B and C, respectively. The orientation and color scheme of the models has been maintained from D. The manual fit and DMD models are related to each other by an approximately 180° rotation, with H4 at the F-actin interface. H4 is purple and pink in the manual fit and DMD model, respectively. Residues I997 and V1001 are labeled and shown as yellow and red sticks in the respective models. See also Figure S2, Table S1.

