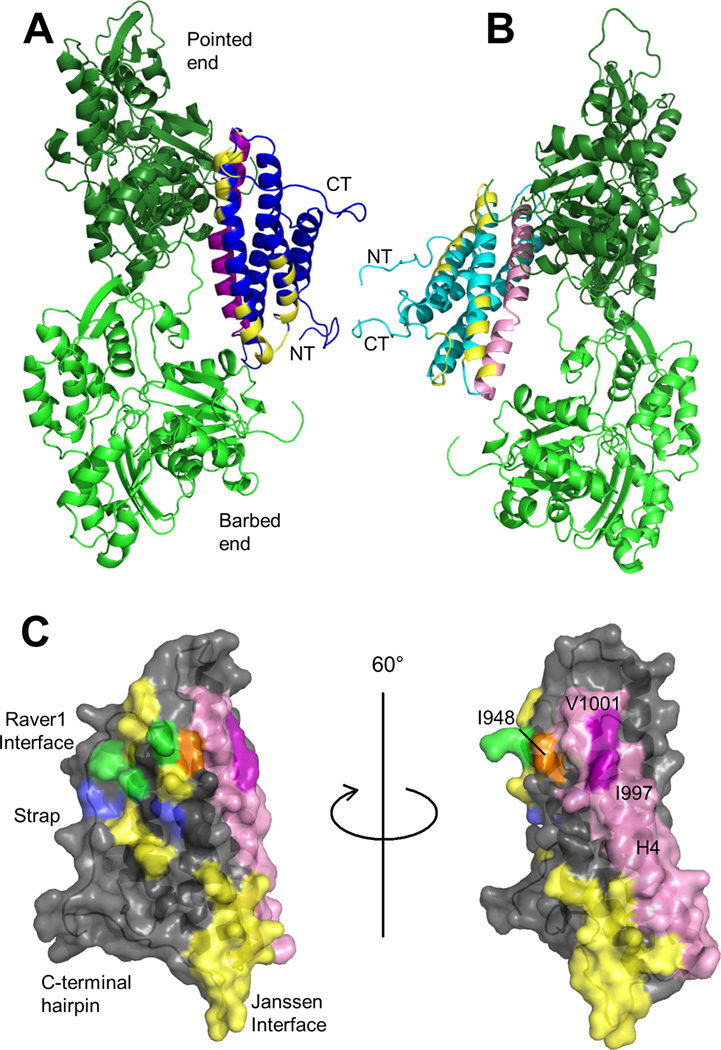
Figure 5. The proposed binding surface is not accounted for in the J-model.
(A) Manual fit model of the Vt:F-actin complex with the J-model surface mapped on Vt. The actin protomers are green. Vt is blue, with H4 in purple. The N- and C-termini are labeled. Yellow residues were identified in the J-model as mediating the Vt:F-actin interaction (Janssen et al., 2006). (B) Vt:F-actin complex from DMD model with the J-model surface mapped on Vt. The actin protomers are green. Vt is cyan, with H4 in pink. The Vt termini are labeled. Yellow residues were identified in the J-model as part of the Vt:F-actin interaction surface. (C) The J-model surface, raver1 interface, and H4 on Vt. Vt is shown with a semi-transparent surface in gray. Residues in the J-model interface are yellow. Those in the raver1 interface are blue (Lee et al., 2009). Those shared between the J-model interface and the raver1 interface are green. H4 is in pink. I997 and V1001 are purple and labeled, while I948 is orange. Two views are shown, rotated 60°. Note that I997 and V1001 are distal from the J-model actin binding interface.

