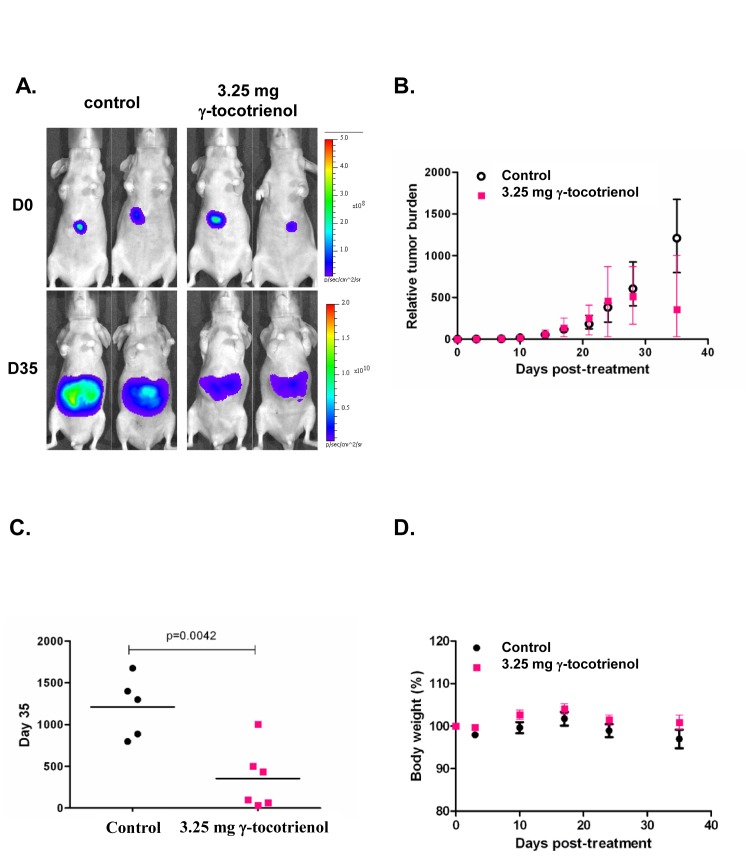
Figure 6. In vivo antitumor activities of γ-tocotrienol in mice orthotopically implanted with the human HCCLM3 tumor.
A) Representative bioluminescent images of control and treated mice. D= day. The colour scale depicts the photon flux (p/s) emitted. B) Tumor growth in Balb/c nude mice bearing orthotopically implanted HCCLM3-Luc tumors treated with vehicle alone (n = 5) or 3.25 mg γ-tocotrienol (n = 6). Point= mean; bars= SE. C) Relative tumor burden at time of euthanasia. Bar= mean. D) Observed body weight (baseline set as 100%). Values are given as means ± SEMs for each group.

