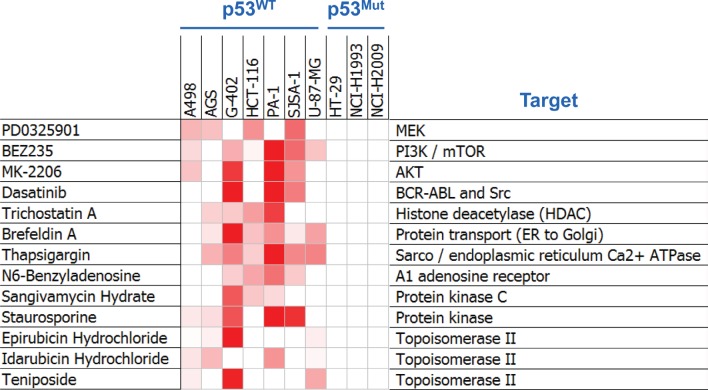
Figure 1. Combination Screening Yielded Hits Exhibiting p53-Dependent Synergy with MDM2 Inhibition.
Heat-map representation of synergy scores from the thirteen compounds shown to synergize with MDM2 inhibition. Cell viability was assessed by ATP quantification following 72 hours of inhibitor treatment. Synergy scores were calculated using the Loewe additivity model. Darker red indicates greater synergy. See also Tables S1-S3.

