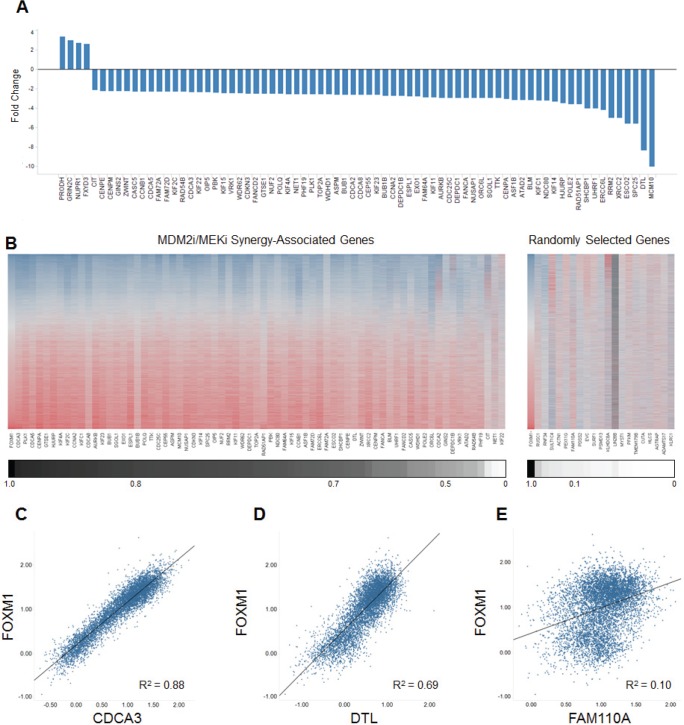
Figure 5. Combining MDM2 and MEK Inhibition Yields a Profile of Expression Changes that Overlaps the FOXM1 Transcriptional Target Signature.
(A) Fold changes in expression of the 74 MDM2i/MEKi synergy-associated genes common to both the RKO and A427 cell lines. Synergy-associated genes were defined as those whose expression increased or decreased by 1) 3.75-fold when comparing the combination group to the DMSO control and 2) 2.2-fold when comparing the combination group to both single-agent groups (synergy-associated genes had to meet both criteria). (B) Heat-map representation of the expression correlation between FOXM1 and the 70 downregulated MDM2i/MEKi synergy-associated genes or 20 unrelated randomly selected genes. Heat map reflects RNAseq RPKM expression values obtained from 6466 TCGA primary tumor samples of diverse tumor origin (20 indications). Lower scale reports coefficient of determination (R2) values for pair-wise linear regression analysis comparing FOXM1 expression to each of the 70 MDM2i/MEKi synergy-associated genes or 20 unrelated randomly selected genes. (C-E) Scatterplots for FOXM1 and synergy-associated genes (C) CDCA3 and (D) DTL or randomly selected gene (E) FAM110A. Scatterplots report RNAseq log10 RPKM expression values for 6466 TCGA primary tumor samples of diverse tumor origin (20 indications)

