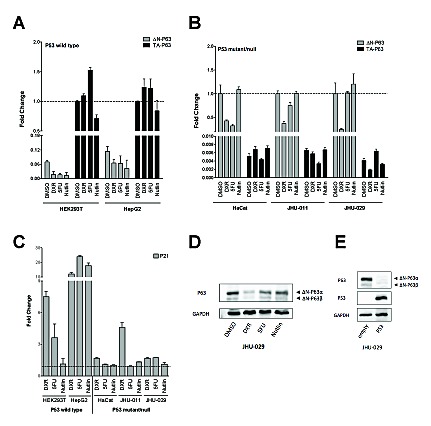
Figure 5. Relative expression of endogenous P63 isoforms in cells lines treated with DNA damaging or P53 inducing agents.

Experiments were conducted in the indicated cell lines with known P53 status (wild type, mutant or null, as indicated). Cells were treated with Doxorubicin (DXR), 5-FluoroUracil (5FU) or Nutlin-3a (Nutlin) for 16 hours, as described in Materials and Methods. B2M and GAPDH served as reference genes. Three biological replicates were performed. Measurements of the endogenous levels of ΔN-P63 or TA-P63 mRNAs in P53 wild type A) or mutant/null cells B). For each cell line the graph indicates the relative expression changes and is normalized over the most abundant isoform transcript, set to 1 for the DMSO (mock solvent condition, broken line). C) The endogenous levels of the P53 target gene P21 were measured as a positive control of the efficacy of the treatments. Values are indicated as fold change relative to DMSO treated cells (set to 1 and indicated by broken line). D) ΔN-P63 protein levels were determined by Western blot in JHU-029 cells after treatment with DXR, 5FU or Nutlin. GAPDH was used as loading control. Immunoreactive bands specific for the ΔN-P63α or ΔN-P63β isoforms are indicated with black arrows. E) Western blot experiment demonstrating the over-expression of P53 after transfection and its effect on endogenous ΔN-P63α or ΔN-P63β isoforms in JHU-029 cells. GAPDH was used as loading control.
