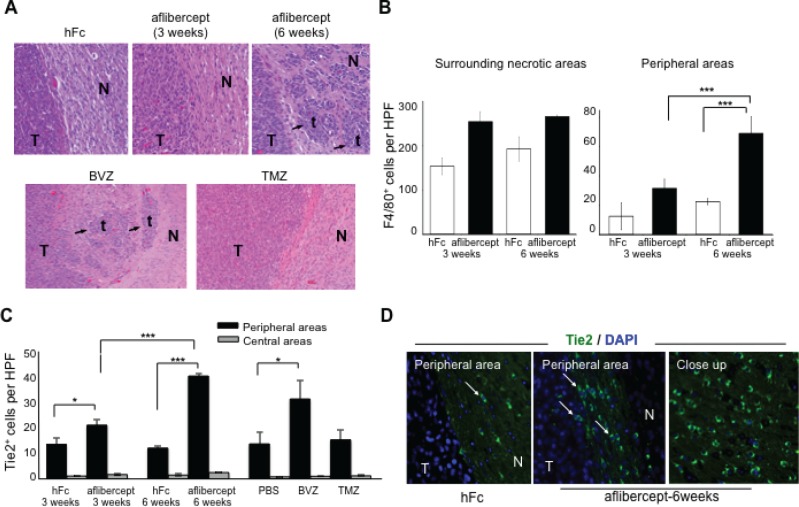
Figure 1. Accumulation of tumor-infiltrating microglia/macrophages and Tie2+ cells at the tumor edge of intracranial U-87 MG glioma-bearing mice after anti-VEGF treatment.
(A) Anti-angiogenic treatment induced invasive tumor outgrowth in the malignant glioma model. Tumor sections from mice treated, as indicated in Methods section, with hFc (control), aflibercept (for 3 weeks or 6 weeks), bevacizumab (BVZ), or TMZ were stained with Harris hematoxylin and eosin. Arrows point to tumor nodules and satellitosis in sections from tumor-bearing mice that received aflibercept for 6 weeks or bevacizumab. No invasive glioma features (N, normal brain; T, tumor; t, tumor nodule) were observed in animals treated with hFc, aflibercept for 3 weeks, or TMZ. Magnification: upper row (20x), lower row (10x). (B) Quantification of F4/80+ cells in surrounding necrotic tumor areas and in peripheral tumor/normal brain edges in mice treated with hFc or aflibercept as indicated. F4/80+ cells were counted with a high-power field (HPF) (200x). Data are presented as mean ± SD (n = 4-5 animals per group). *** P < 0.001. (C) Quantification of Tie2+ cells at glioma tumor edge and at the tumor center from mice treated with hFc for 3 weeks or 6 weeks, aflibercept for 3 weeks or 6 weeks, phosphate-buffered saline (PBS; a control), bevacizumab, or TMZ. Tie2+ cells were counted with a high-power field (HPF) (200x). Data are presented as mean ± SD (n = 4-5 animals per group). * P < 0.05; *** P < 0.001. (D) Representative images of Tie2 staining of sections from mice treated with hFc or aflibercept (6 weeks). Pictures show merged fluorescent Tie2 (green) and DAPI (blue). Arrows indicate Tie2+ cells. N, normal tissue; T, tumor. Magnification: 200x; closeup, 400x.

