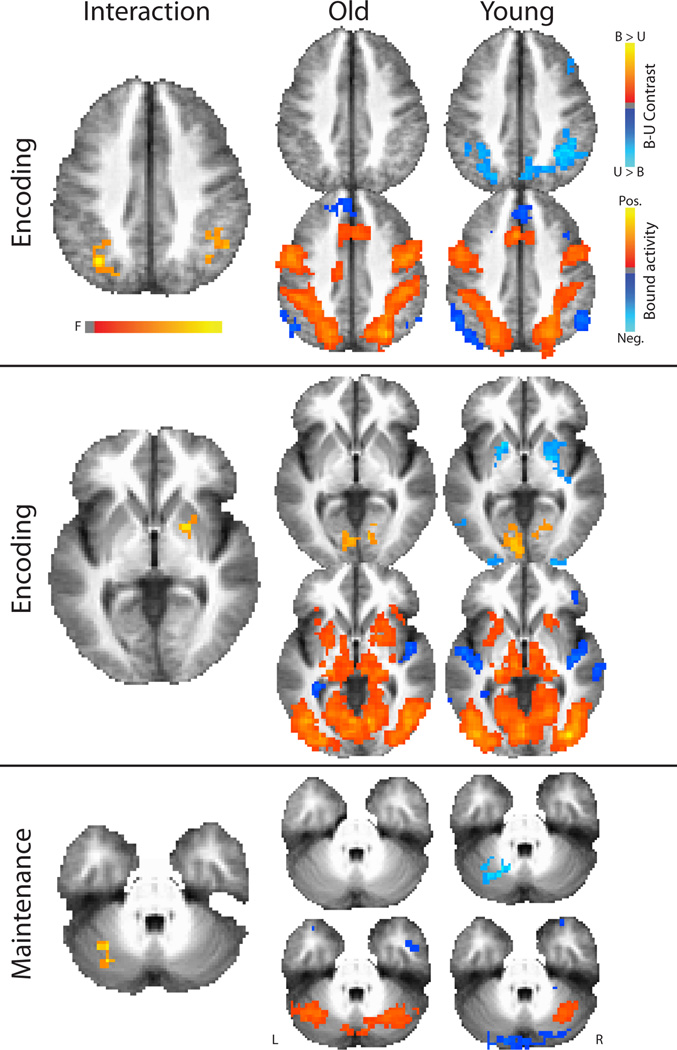
Figure 3.
There were significant interactions between age and task in brain activity. The phase at which each interaction occurred is indicated to the left of each row. The images in the top row to the right of each interaction includes the contrasts of bound minus unbound for each age group to illustrate the differences driving the interaction. The lower row of images to the right of each interaction are the bound task activity for each age group to illustrate regions that were task positive and task negative. Interaction images are displayed at a multiple comparison corrected level of 0.05, while the other images are displayed at an uncorrected level of 0.01 for illustrative purposes only.

