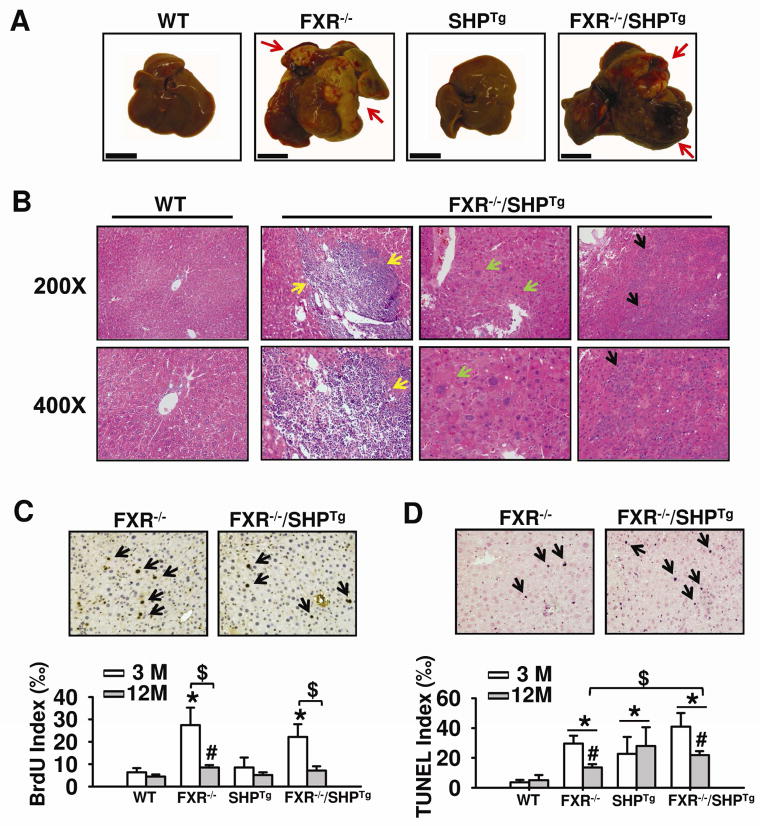
Figure 2. Liver tumor development in WT, FXR−/−, SHPTg and FXR−/−/SHPTg mice.
(A) Representative liver morphology of WT, FXR−/−, SHPTg and FXR−/−/SHPTg mice at 18-month-old shows grossly identified liver tumor nodules (arrows). The scale bar indicates 1cm. (B) Liver H&E staining indicates portal inflammation (yellow arrows), hepatocyte dysplasia (green arrows), and HCC (black arrows). The representative pictures were from FXR−/−/SHPTg mice at 18-month old. Magnification, 200X and 400X. (C) Quantification of the hepatocyte BrdU incorporation index from livers of 3- and 12-month-old mice of each genotype. The representative pictures are from livers of 3-month-old FXR−/− and FXR−/−/SHPTg mice. An asterisk or pound indicates P < 0.05 between WT and FXR−/− or FXR−/−/SHPTg groups at the same age. A dollar sign means P < 0.05 between 3- and 12-month-old mice of the same genotype. (D) Quantification of TUNEL assay results from livers of 3- and 12-month-old mice from each genotype. The representative pictures are for livers of 3-month-old FXR−/− and FXR−/−/SHPTg mice. An asterisk indicates P < 0.05 between WT and other groups of the same age. A pound sign indicates P < 0.05 between 3-month and 12-month-old mice of the same genotype. A dollar sign indicates P < 0.05 between FXR−/− and FXR−/−/SHPTg mice of the same age.

