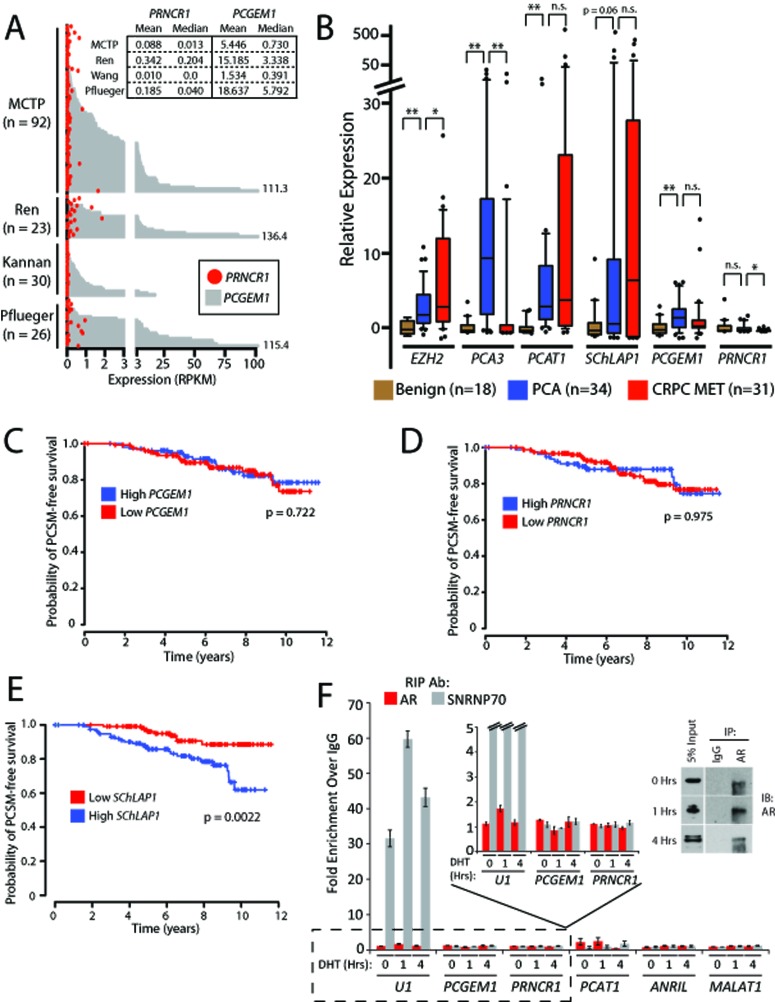
Figure 1. PCGEM1 and PRNCR1 are not associated with prostate cancer progression and do not bind the androgen receptor.
(A) Plot showing PCGEM1 (grey bars) and PRNCR1 (red circles) expression levels (Reads per Kilobase per Million Reads, or RPKM) across 171 samples from four RNA-Seq studies of prostate cancer: Michigan Center for Translational Pathology (MCTP, internal data and dbGAP, phs000443.v1.p1), Ren et al. [13] (EGA, ERP00550), Kannan et al. [14] (GEO, GSE22260), and Pflueger et al. [12] (dbGAP, phs000310.v1.p1). Inset box shows descriptive statistics for each study. (B) Quantitative PCR for PCGEM1 and PRNCR1 in a cohort of prostate cancer tissues, benign (n = 18), localized cancer (n =34), metastatic cancer (n = 31). An asterisk (*) indicates p < 0.05. Two asterisks (**) indicate p < 0.01. n.s. = non-significant. P values were determined by a two-tailed Student's t-test. Data for SChLAP1 is obtained and re-analyzed from a prior publication (ref. [4]). (C) PCGEM1 expression does not predict for prostate cancer-specific mortality (PCSM). (D) PRNCR1 expression does not predict for PCSM. (E) High SChLAP1 expression is a powerful predictor of PCSM (p = 0.0022). Data in (E) is reproduced from a prior publication (ref. [4]). P values in (C-E) are determined using a log-rank test. (F) RNA- immunoprecipitation (RIP) for AR following stimulation of LNCaP cells with 100nM DHT does not show binding of PRNCR1 or PCGEM1 to AR. U1 binding to SNRNP70 is used as a positive control. PCAT-1, ANRIL, and MALAT1 serve as negative controls. Inset: Western blot confirmation of AR protein pull-down by the immunoprecipitation assays. Error bars represent S.E.M.

