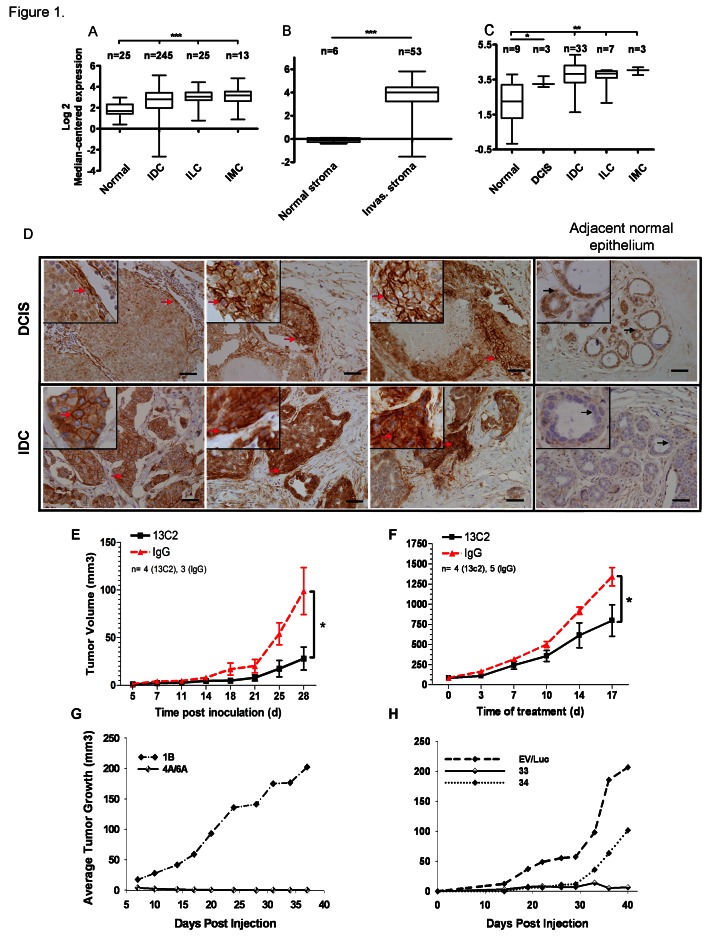
Figure 1. CDH11 mRNA and protein are expressed in ductal carcinoma in situ and invasive breast carcinoma and regulates growth of MDA-MB-231 breast cancer transplanted cells.
(A) CDH11 transcript is significantly increased in invasive carcinoma compared to normal breast (http://cancergenome.nih.gov), (B) and in invasive cancer stroma compared to normal stroma [11]. (C) Significant CDH11 up-regulation is also seen as an early event in ductal carcinoma in-situ [12]. The fold changes (FC) in the expression level of CDH11 and statistical analysis p values (Welch's t-test) were as follows: (A) Invasive ductal carcinoma, invasive lobular carcinoma and invasive mixed carcinoma vs. normal breast: p<0.0001 for all, FC: 1.75, 2.27, 2.44 respectively, (B) Invasive breast carcinoma stroma vs. normal breast stroma: p<0.0001, FC: 14.239. (C) Ductal carcinoma in-situ vs. normal breast: p=0.0194, FC: 2.160, invasive ductal carcinoma vs. normal breast: p=0.0034, FC: 2.896, invasive lobular carcinoma vs. normal breast: p=0.0077, FC: 2.603, invasive mixed carcinoma vs. normal breast: p=0.0015, FC: 3.413. Data presented as bars and whiskers (D) CDH11 immunohistochemical staining of human DCIS (left to right: comedo-type, cribriform and another comedo-type) and invasive ductal carcinoma as well as adjacent normal epithelium. (E) Growth inhibition of CDH11 positive MDA-MB-231 xenografts (>70%) upon treatment with 13C2 or control IgG with 0.5 mg initial I.P. injection followed by 0.1 mg subsequent injections (x3/week) for a month. (p=0.0365 compared to control (IgG), 28 d, two-tailed student's t-test). (F) Growth inhibition of established MDA-MB-231 tumors (>40%) upon I.P. treatment with 13C2 antibody or control (IgG) at 20 mg per kg body weight (x2/week) beginning when subcutaneous tumors were palpable. (p=0.0394 for 13C2 compared to control (IgG), 17 d post treatment start, two-tailed student's t-test). (G,H): Inhibitory effect of CDH11 knockdown on tumor growth in mice. Athymic nude mice were s. c. injected with 1-2×10⁶ MDA-MB-231 cells stably expressing (G) CDH11 siRNA, or (H) shRNA or controls into 1 of 4 mammary fat pads, such that all cell lines were represented in a minimum 10 total injections each (minimum of 2x per specific locus). For ILC images, please see Supplementary Fig. S2. The red arrows indicate CDH11 membranous staining. Black arrows point to a cell within the region that is magnified in the small insets. Scale bar: 45 μM. Small insets are 2.5x magnification of large images. Data are presented as means ± SEM. IDC, ILC and IMC: Invasive ductal, lobular and mixed carcinomas respectively, Invas: invasive.

