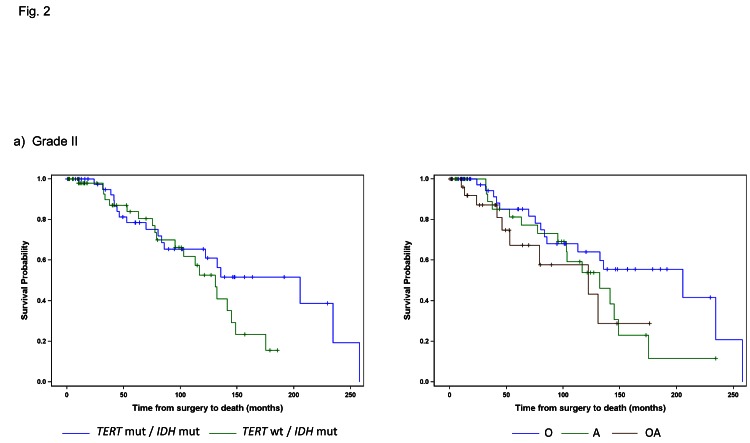
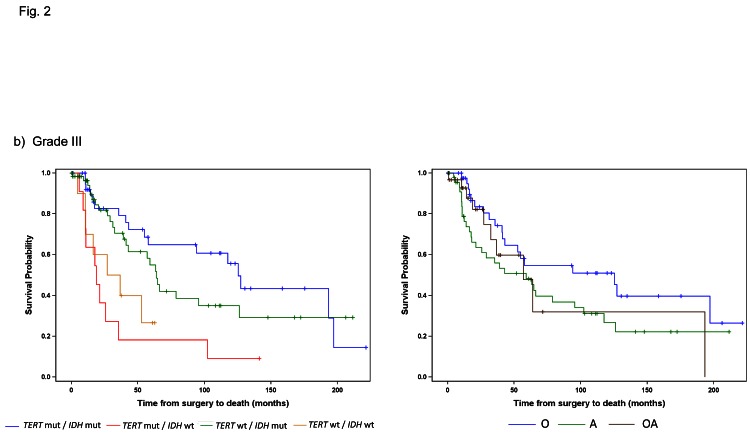
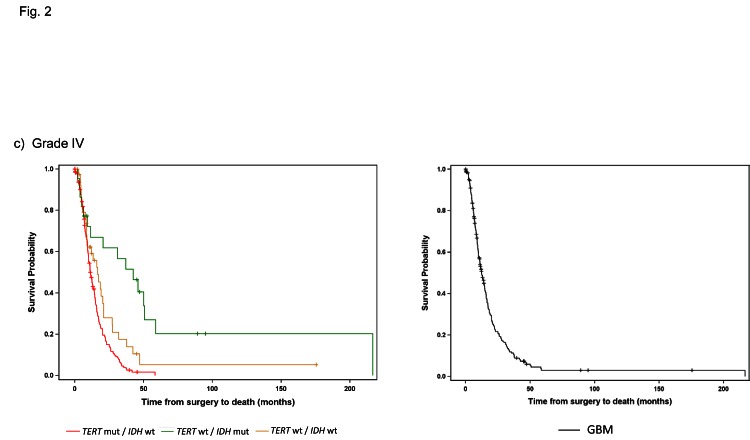
Fig 2. Overall Survival stratified by TERT promoter and IDH1/2 mutational status and histology within each tumor grade.
Overall survival was represented by Kaplan Meier plots for individual WHO tumor grade: a) Grade II (n=103), b) Grade III (n=121), c) Grade IV (n=218). Only subgroups with at least 10 patients were included in the analyses. Tumors were represented by mutations status on the left (TERT promoter status / IDH1/2 status) and histology on the right (A represents Astrocytomas, O represents Oligodendrogliomas, and OA represents Oligoastrocytomas).


