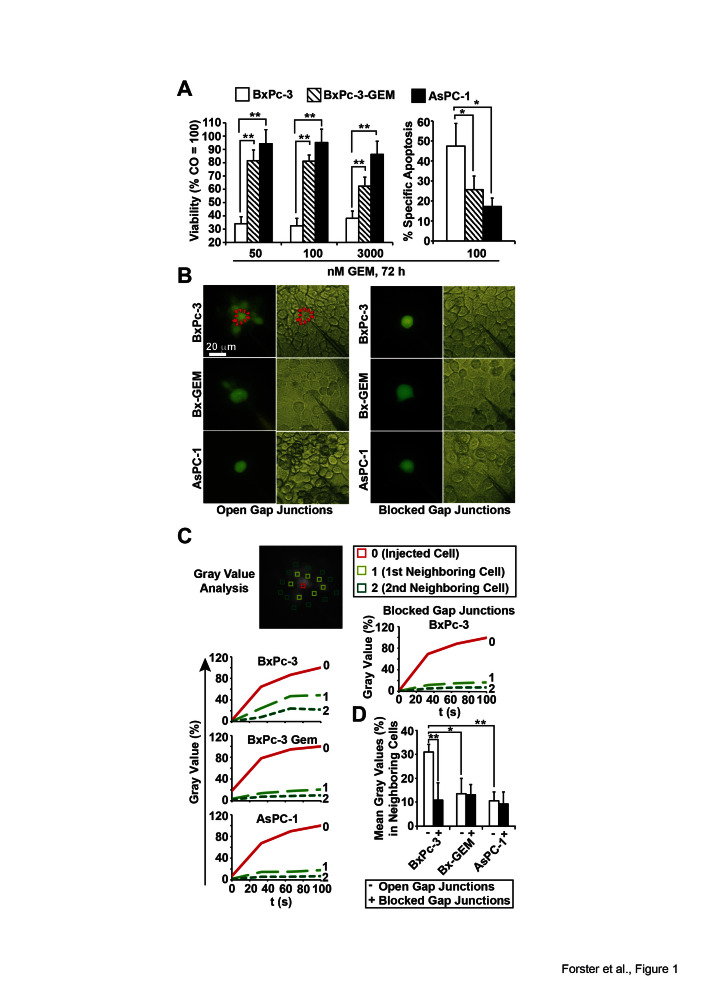
Figure 1. Loss of GJIC correlates with a CSC-phenotype.
(A) BxPc-3, BxPc-3-GEM and AsPC-1 human PDA cells were treated with gemcitabine (GEM) at the indicated concentrations. Seventy-two hours later, viability was measured with the MTT assay and apoptosis by annexin staining followed by FACS analysis. Specific apoptosis was calculated using the formula 100× [(experimental apoptosis %) - spontaneous apoptosis of CO (%)] / [100 - spontaneous apoptosis of CO %]. (B) After microinjection of Lucifer Yellow the diffusion of dye from the injected cell to neighboring cells was detected by fluorescence microscopy and video recording in the presence or absence of the gap junction blocker 18αGA (10 mM), which was incubated for 30 min prior to the injection of Lucifer Yellow. Representative images from fluorescence and light microscopy are shown. Representative cells injected with Lucifer Yellow are marked by dotted lines, and the scale bar indicates 20 μm. (C) Gray values of the injected cell (0, red line), the first raw of neighboring cells (1, light green-dotted line) and the second raw of neighboring cells (2, middle green-dotted line) were determined from the video pictures at the time points 0, 20, 40, 60, 80 and 100 s after injection of lucifer yellow and are shown in the diagrams. (D) The means of gray values of all neighboring cells per cell line were calculated and are shown in the diagram ± SD. **p < 0.01; *p< 0.05.

