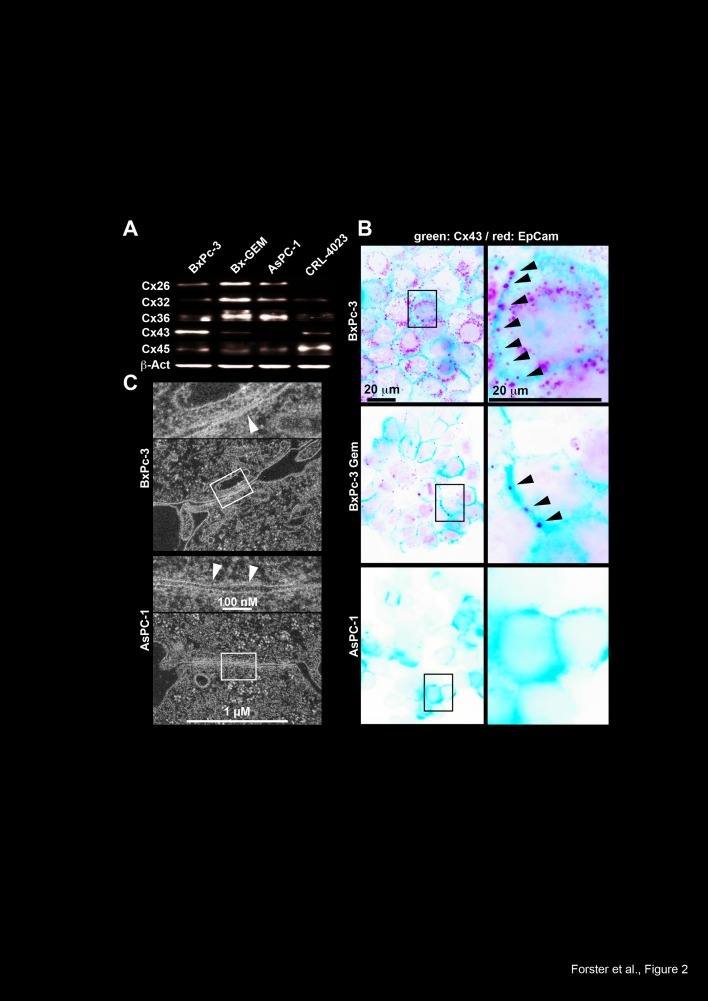
Figure 2. Loss of Cx43 expression in cells with CSC features.
(A) Proteins were harvested from PDA cells and immortalized pancreatic ductal cells (CRL-4023), and the expression of Cx26, Cx32, Cx36, Cx43 (anti-Cx43 Ab was from Invitrogen) and Cx45 was analyzed by Western blot. The expression of β-Actin (β-Act) served as a loading control. (B) The expression and cellular localization of Cx43 (Cell Signaling) was analyzed by double immunofluorescence staining using antibodies specific for Cx43. Co-staining with the cell surface protein EpCAM was performed to mark the cell surface. Cx43-positive cells were visualized with Alexa Fluor 488 (green), and EpCAM-positive cells were visualized with Alexa Fluor 594 (red). The arrows mark Cx43 expression on the cell surface. Cells were analyzed under 400× magnification using a Leica DMRB fluorescence microscope. Images of representative fields were captured using a Kappa CF 20/4 DX digital color camera (Kappa GmbH, Gleichen, Germany) and Kappa ImageBase 2.2 software. All photographs were taken at the same magnification, and the scale bar indicates 20 μm. (C) Electron microscopy of gap junction-like cell-cell contacts of BxPc-3 and AsPC-1 cells. The arrows indicate the extension of junctions with a narrow gap in BxPc-3 cells, and the inserts show details of the gaps at higher magnification. The scale bar indicates 1 μm.

