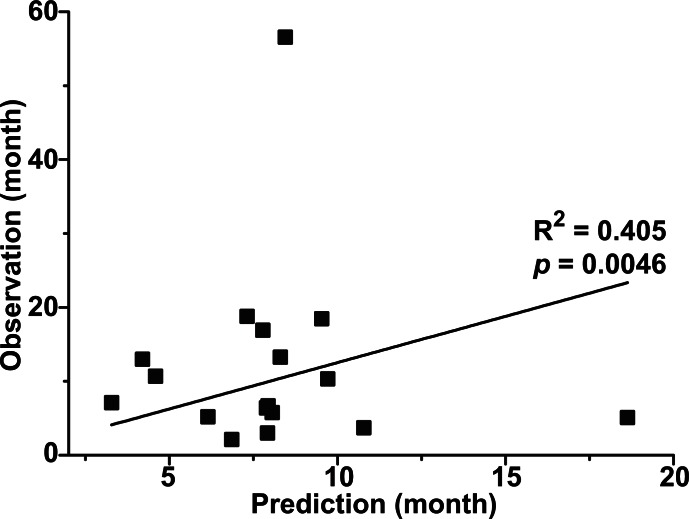
Figure 4. Prediction of cancer-specific survival time.
The PLS prediction model was obtained with three components (R2 = 0.991, Q2 = 0.404). The X-axis corresponds to the predicted values that were calculated by using the PLS regression followed by the leave-one-out prediction. The Y-axis corresponds to the actual cancer-specific survival time. The R-squared value of the linear regression is 0.405 and the p-value is 0.0046.

