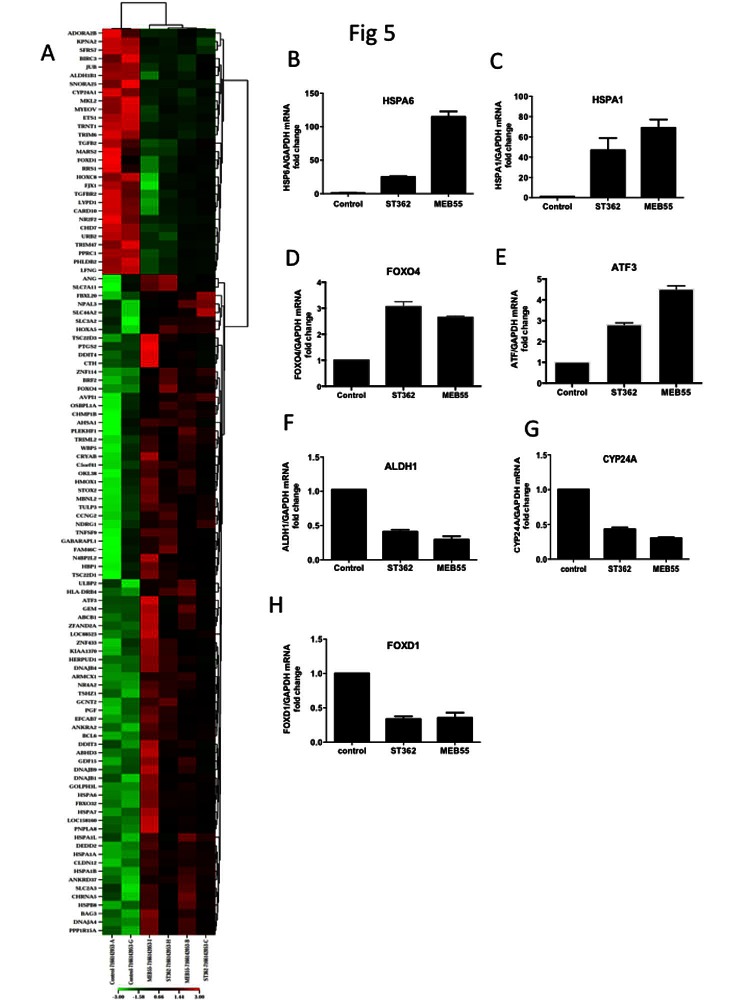
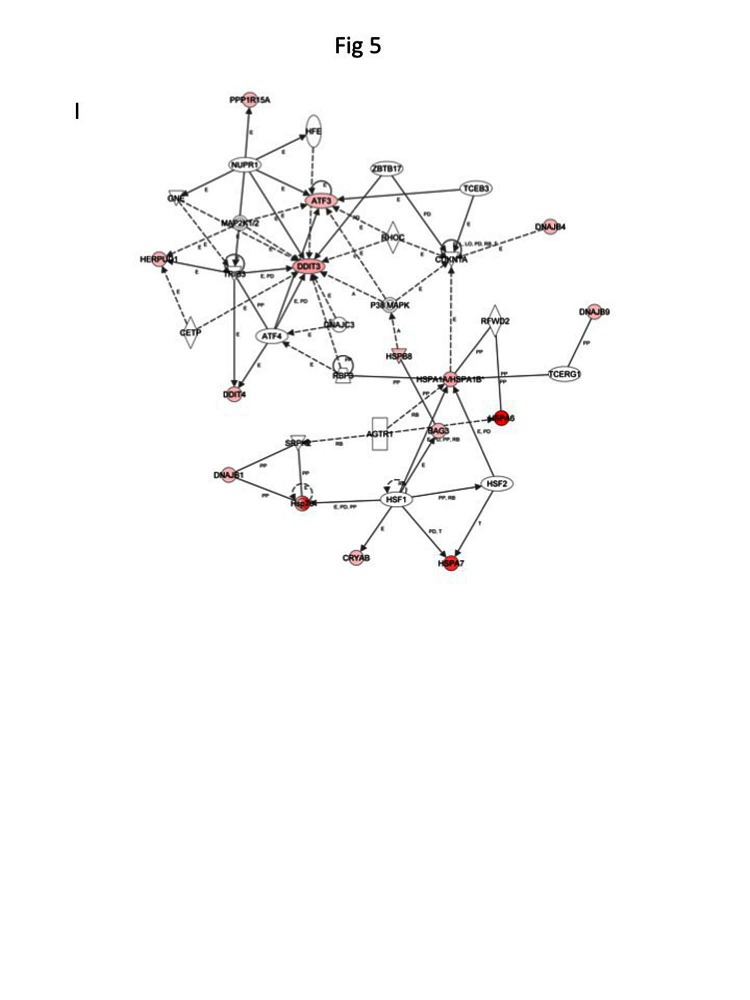
Figure 5. Global changes in gene expression following treatment with ST362 or MEB55.
A. U2OS cells were treated with vehicle or 5 ppm of ST362 or 5 ppm MEB55 for 6 hrs. Total RNA was extracted and analyzed by expression array. Results of two independent experiments are displayed as a Heatmap of genes differentially expressed in U2OS cells treated with MEB55 or with ST362 for 6 hrs. Genes that were ±2 fold p≤0.05 upregulated are shown in red and down regulated transcripts are shown in green. A representative list of individual genes at 6 hrs (±2 fold p≤0.05) is presented in Table 2 and at 24 hrs in Table S1. B-H qRT-PCR analysis of representative genes in A. I. A protein network of top upregulated genes in response to MEB55 and ST362 was constructed using the Ingenuity software.


