
Figure 6. Extra-dosage of Dyrk1a in Down syndrome-derived fibroblasts contributes to G1 cell cycle changes.
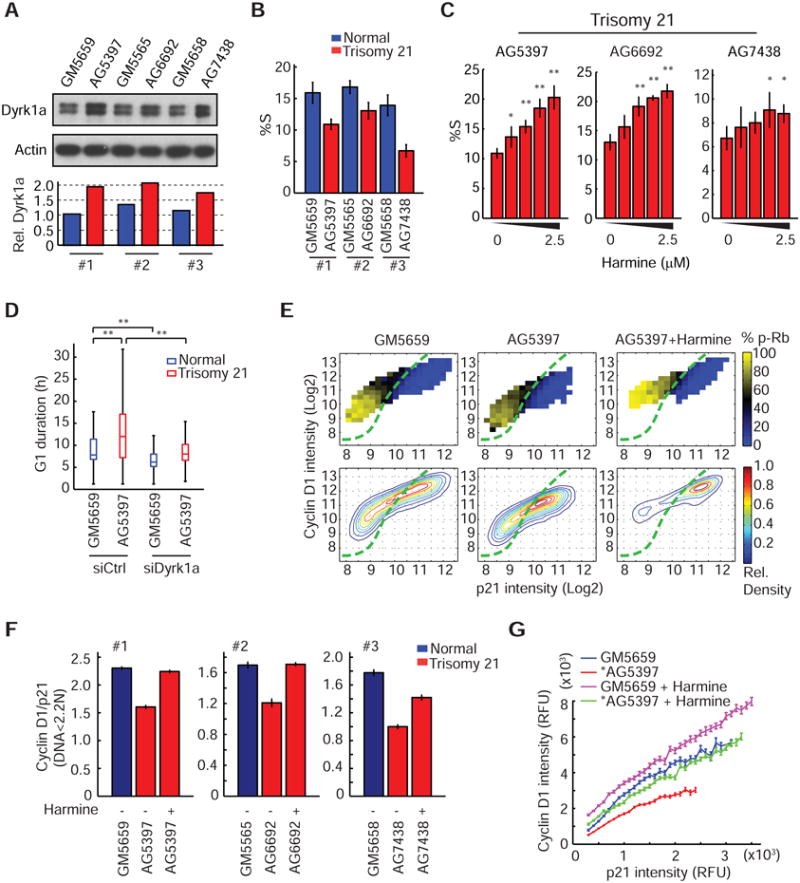
(A) An extra-copy of Dyrk1a gene in DS-derived fibroblasts increases Dyrk1 protein level by 1.6-fold. Representative western blot (top) and the quantification of band intensity (bottom) are shown. Three pairs of age-matched normal (blue) and DS cells (red) were used for the analysis. (B) Quantification showing reduced proliferation (%S) in DS cells (mean ± SD of 6 replicate wells). (C) Dose-dependent increase of proliferation in DS cells treated with Harmine (0 to 2.5μM, 2-fold dilution from the right; mean ± SD of 4 replicate wells; **: p<0.01; *: p<0.05). (D) Box plot showing an increase of G1 duration in DS cells compared to its age-matched control and that this increase could be reduced by knockdown of Dyrk1a (**: p<0.01). (E) Heat map analysis showing a shift of the DS cell (AG5397) distribution toward lower CycD1 levels (middle) compared to the normal control (GM5659) (left). Addition of Harmine rescues the shift and further pushes the population to the top-right quadrant (right). Assays were performed as described in Figure 5D. The boundary was drawn according to GM5659 cells. (F) Quantification showing a decrease of CycD1/p21 ratio in DS cells and that the decrease was restored by Harmine treatment (mean ± SD of 4 replicate wells). (G) The ratio decrease in DS cells (*) shown in (F) is due to a relative decrease of CycD1 when compared within the same p21 binning intensity. The decrease was rescued by Harmine treatment (mean ± SEM, n> 50 cells per bin). See also Figure S7.