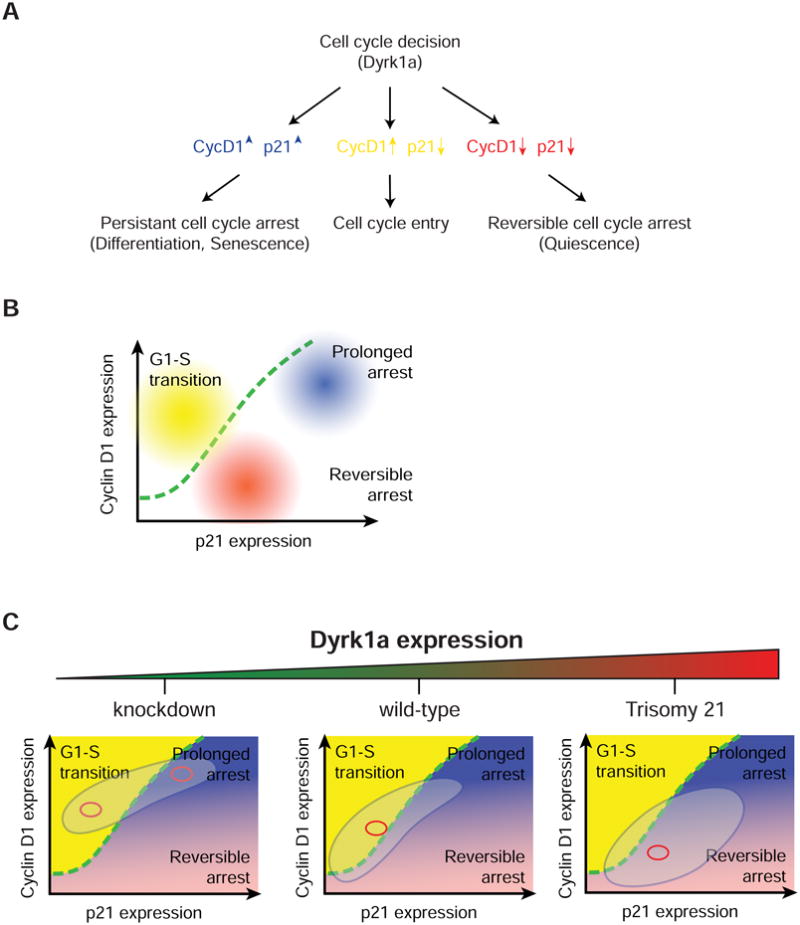
Figure 7. Dyrk1a-mediated shifts in the p21-CycD1 signaling map lead to cell cycle entry or one out of the two cell cycle exit decisions.

(A & B) Schematic and graph representation showing that three cell fates including the G1-S transition (cycling state), reversible G1 arrest (non-cycling state) and prolonged arrest (non-cycling state) can be distinguished by their respective 2D p21-CycD1 signaling map. (C) Dyrk1a dosage-induced p21-CycD1 response that spreads the population of cells across different cell fate regions. Red circle depicts the center of mass. The big circle depicts the population distribution.
