FIGURE 9.
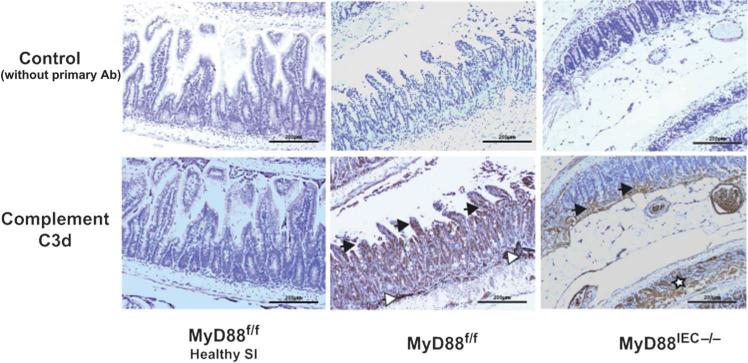
Complement activation is impaired in I/R-exposed Myd88IEC−/− compared with Myd88f/f mice. Myd88f/f and Myd88IEC−/− mice (n = 5) were subjected to 60-minute ischemia only, and complement c3d expression was determined using IHC. Complement 3d staining is also shown for healthy small intestinal tissue of Myd88f/f mice (healthy SI). Black arrows: accumulation of complement 3d staining at the tip of the villi (region i.e., being affected first during I/R injury and region with accumulation of IgA). White arrows: complement staining in submucosal blood vessels. White stars: complement staining only seen in crypts of Myd88IEC−/− mice when histological damage exceeds stage 2 (absence of villi but visible crypts). Scale bars = 200 μm. Representative images are shown of 2 independent experiments.

