
Figure 4.
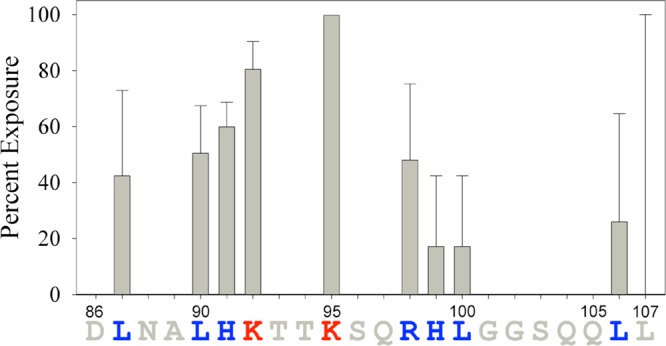
SEM1(86–107) fibril core sequence determined by hydroxyl radical-mediated modification. Vertical bars represent the percent exposure of residues in the SEM1(86–107) fibrils as calculated by eq 5. Residues colored red are exposed, while residues colored blue are protected and predicted to be part of the fibril core. The percent exposure values of residues colored gray were not determined by this method. Error bars reflect the standard deviations of three independent experiments.