
Figure 5.
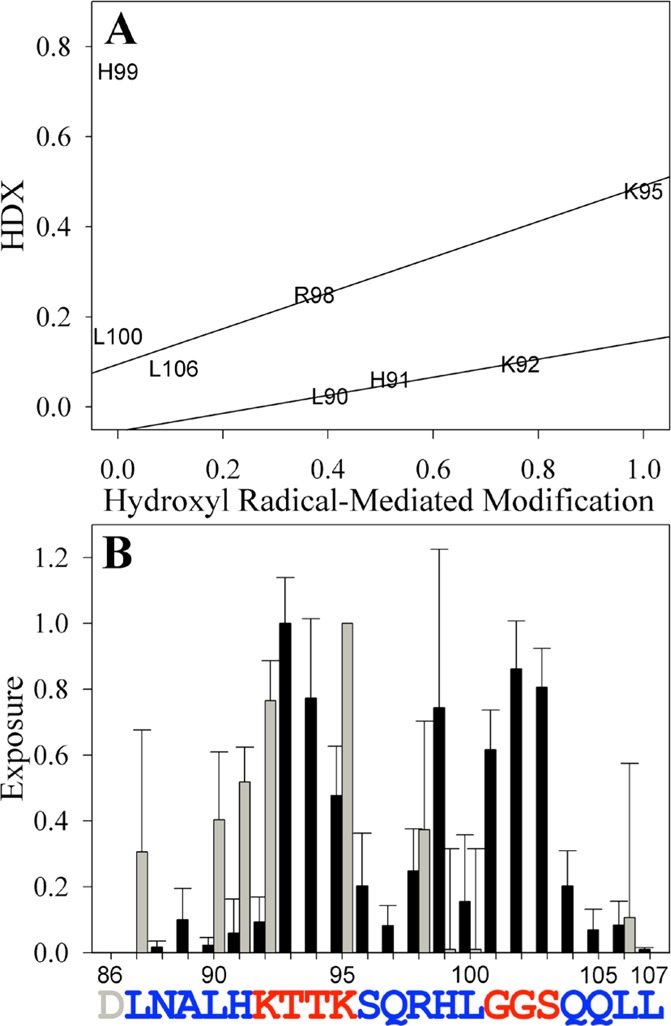
Correlation between HDX and hydroxyl radical-mediated modification data assessing the SEM1(86–107) fibril core sequence. The percent HDX (Figure 3) and percent hydroxyl radical-mediated modification (Figure 4) were rescaled between zero and one and compared in a correlation plot (A) or directly (B). Lines in panel A are shown to guide the eye. Black bars in panel B are the values calculated from HDXMS experiments, and gray bars are the values calculated from the hydroxyl radical-mediated modification assays. Residues colored red are exposed, while residues colored blue are protected and predicted to be part of the fibril core. The exposure of residues lacking bars was indeterminate. Error bars are the standard deviations of at least three independent experiments.