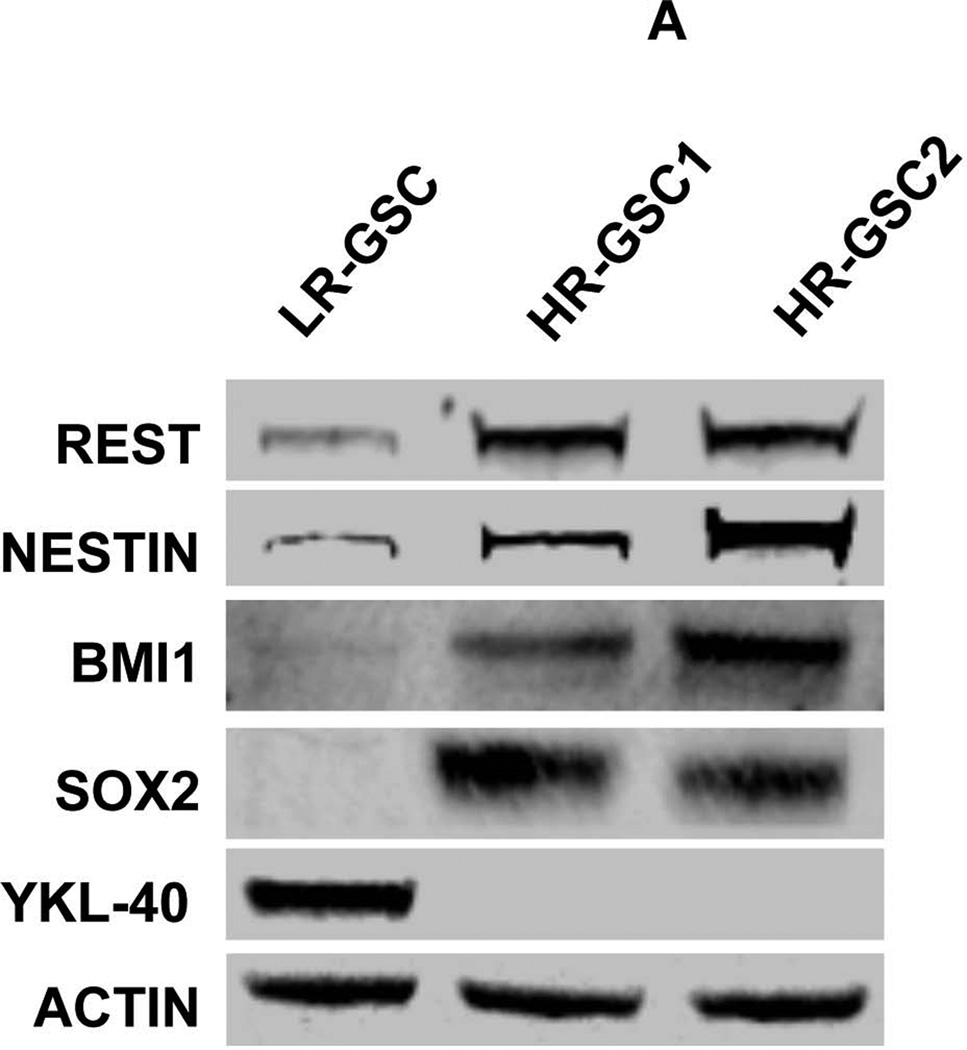
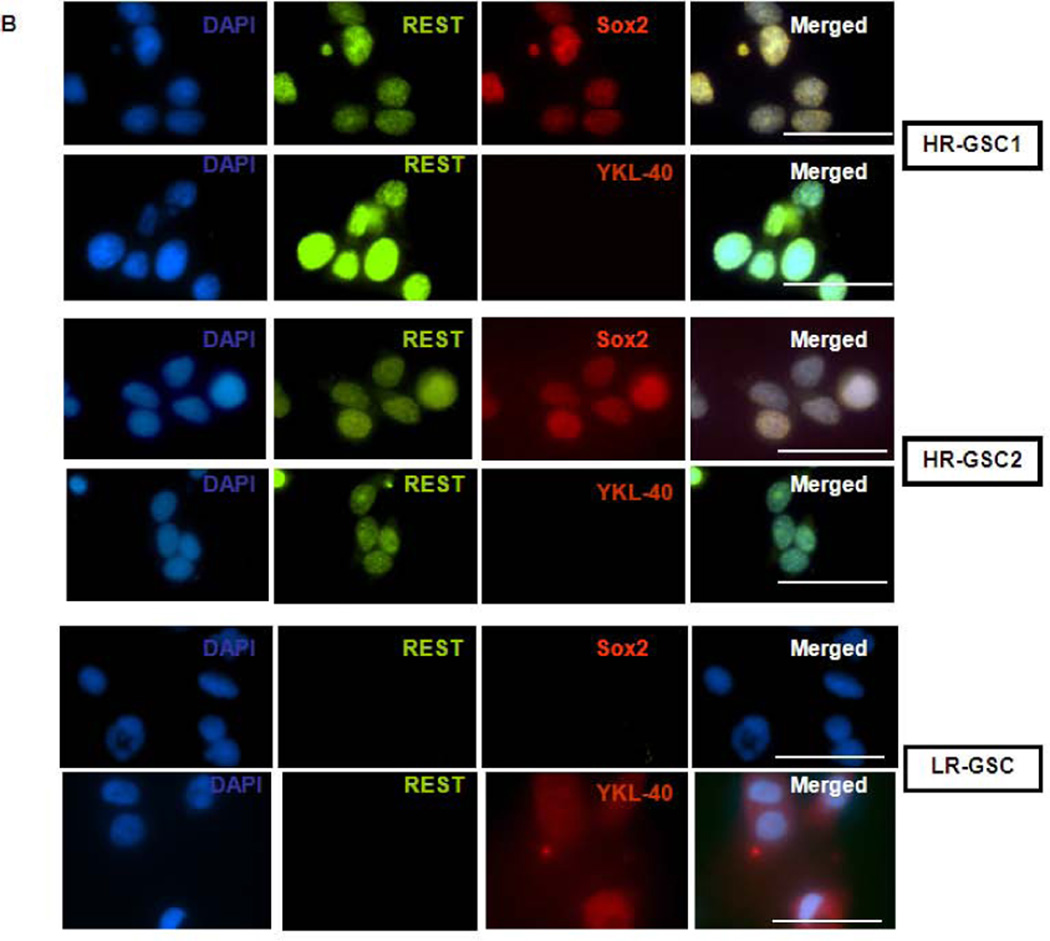
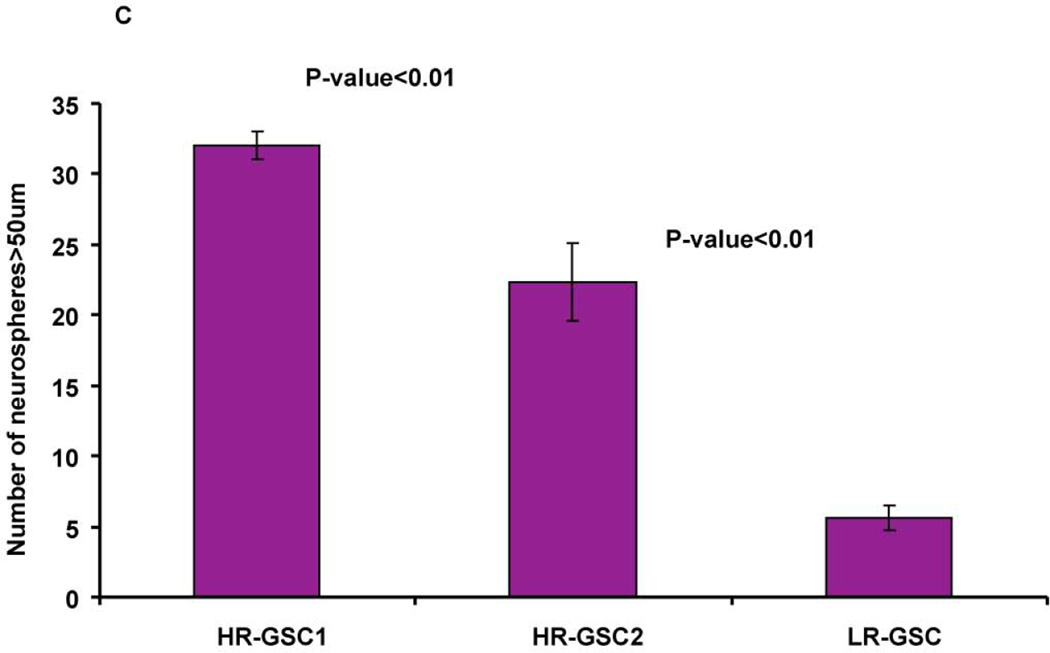
Figure 2. High REST protein expression correlates with stemness markers in GSCs.
(A) Expression of REST, Nestin, Bmi1, Sox2, and YKL40 in two HR-GSCs (HR-GSC1 and HR-GSC2) and one LR-GSC were determined by Western blotting assays. Actin was used as an internal control. (B) Immunofluorescence analysis of the two HR-GSCs and one LR-GSC shows a distinct pattern of expression of Sox2, and YKL-40. The bar in the figures represents 50 micron. (C) HR-GSCs (HR-GSC1 and HR-GSC2) show higher neurosphere-formation ability compared to LR-GSCs.


