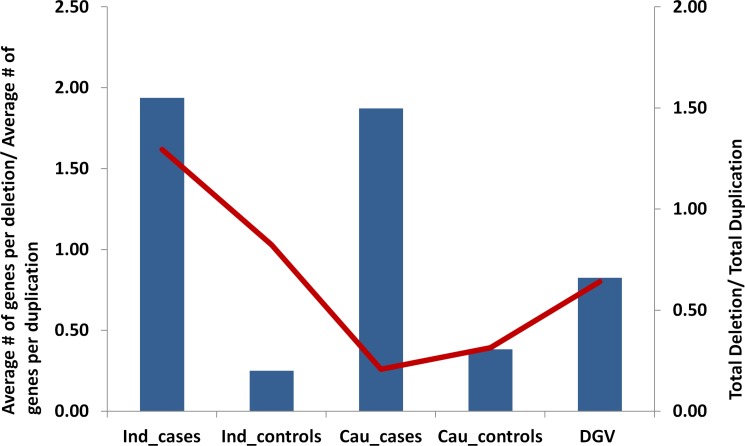
Figure 2.
Large deletions of > 1 Mb, enriched in genic regions, are overrepresented in glaucomatous neurodegeneration. Individual CNV calls > 1 Mb are analyzed for their possible impact in the disease. The vertical bars show the ratio of deletions/duplications overlapping with known protein-coding genes. The left vertical axis reflect the values. Note the higher number of genes under deletions specifically in cases. The red line is the ratio for all deletions/all duplications > 1 Mb. The values are reflected at the right vertical axis. Note that, except Indian cases, for all other groups the total number of duplications is higher than that of deletions (ratio < 1). Indian and the Caucasian POAG cases show a much larger fraction (∼2-fold) of deletions possibly disrupting protein-coding genes compared to corresponding controls. The larger dataset of DGV also matches with the trend observed in POAG controls. The source data for this plot is given in Supplementary Table S3.

