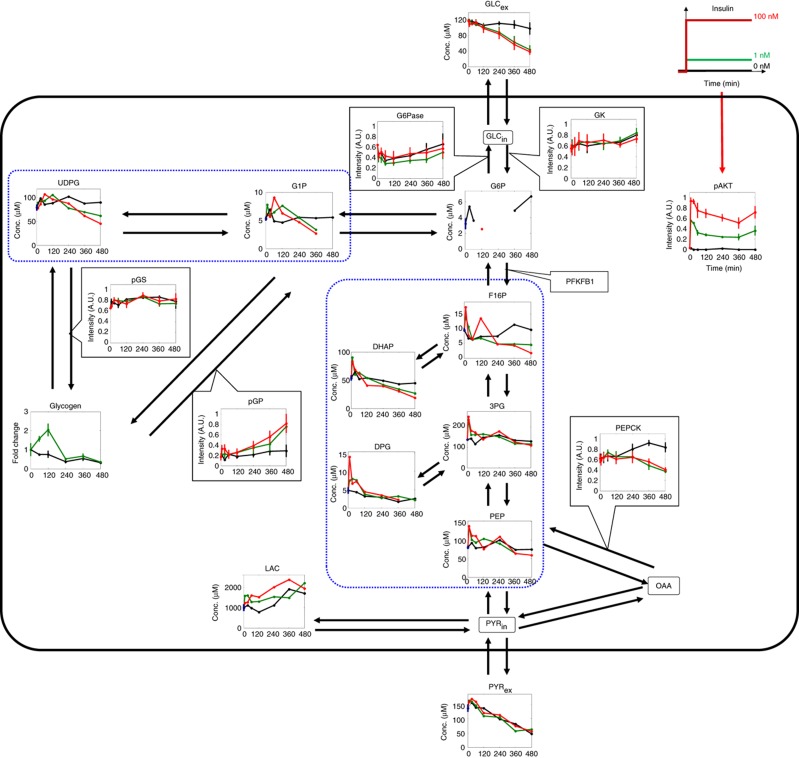
Figure 1.
Insulin-dependent glucose metabolism. The changes in the indicated intracellular and extracellular metabolites, as well as pAKT, PEPCK, G6Pase, GK, pGS and pGP were measured in response to an insulin step stimulation. The black, green and red lines indicate the insulin concentrations used (0, 1 and 100 nM, respectively). The mean values and SEMs of four (pAKT, PEPCK, G6Pase, GK, pGS and pGP) and three (GLCex and glycogen) independent experiments are shown. The values at t=0 measured by CE-TOF-MS were obtained in triplicate, and the mean values and SEMs of these are indicated at t=0 using a blue dot and blue line, respectively. Highly correlated (Pearson’s correlation coefficient, r>0.63) neighbouring metabolites are surrounded by a dotted blue box. The metabolites inside and outside of the black box are the intracellular and extracellular metabolites, respectively. Note that G6P at some time points were under the detection limit of CE-TOF-MS and were not shown in Figure 1, and that only the time course data of glycogen in response to 0 and 1 nM of insulin are shown because that to 100 nM insulin showed a high variation between experiments (see Materials and Methods). PYRin, intracellular pyruvate. Source data for this figure is available on the online supplementary information page.

