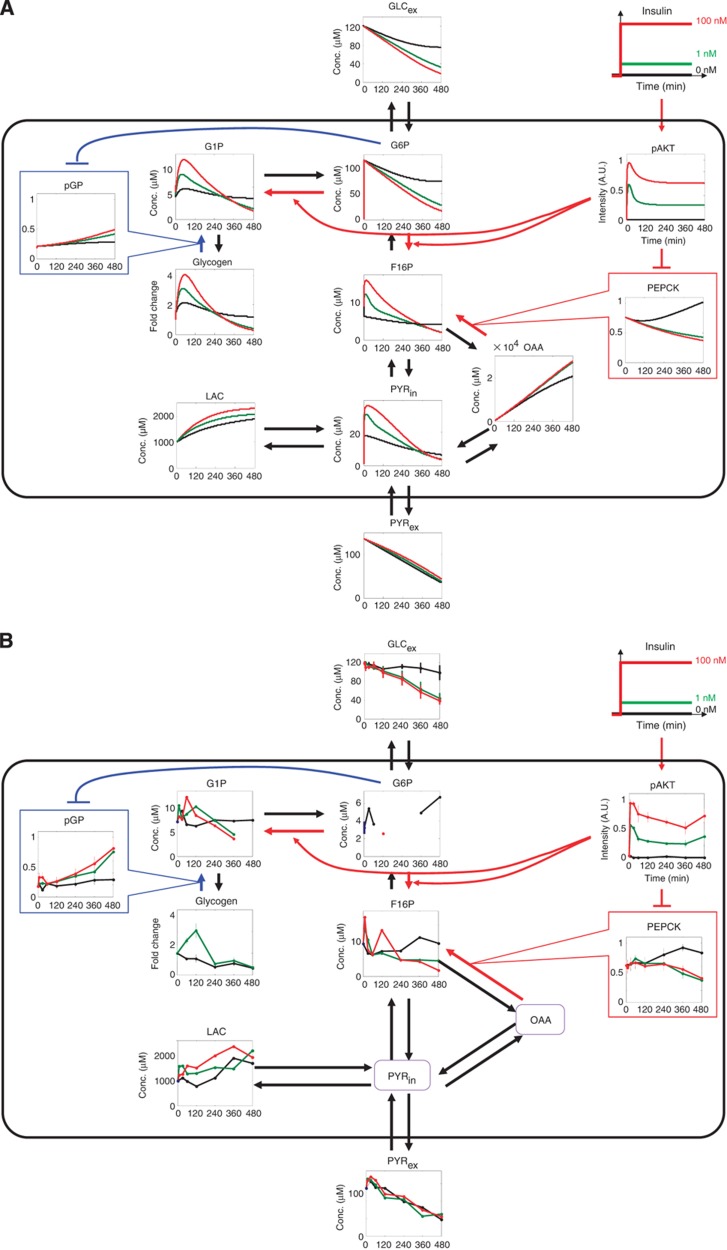
Figure 2.
The computational model of insulin-dependent glucose metabolism. (A) Time courses of the metabolites and enzymes in response to insulin in the insulin-dependent glucose metabolism model (Supplementary Figure 1). The black, green and red lines indicate the insulin concentrations used (0, 1 and 100 nM, respectively). (B) Time courses of the metabolites and enzymes in response to insulin. All data shown are the same as Figure 1, and only the metabolites and enzymes incorporated into the model are shown for comparison. The black, green and red lines indicate the insulin concentrations used (0, 1 and 100 nM, respectively).

